

Most farms don't have an analytics problem. They have an analytics reliability problem. The dashboards exist, the sensors are deployed, somebody built a spreadsheet that calculates field-level margin — and yet when a planting decision or a harvest sequencing call needs to happen fast, nobody trusts the numbers enough to act on them.
That gap between "we have data" and "we can make a decision at 6 a.m. during a narrow window" is what an operating model fixes. Not more charts. A defined set of analytics products, each with owners, acceptance tests, rollback rules, and a cadence that lines up with what's actually happening in the field.
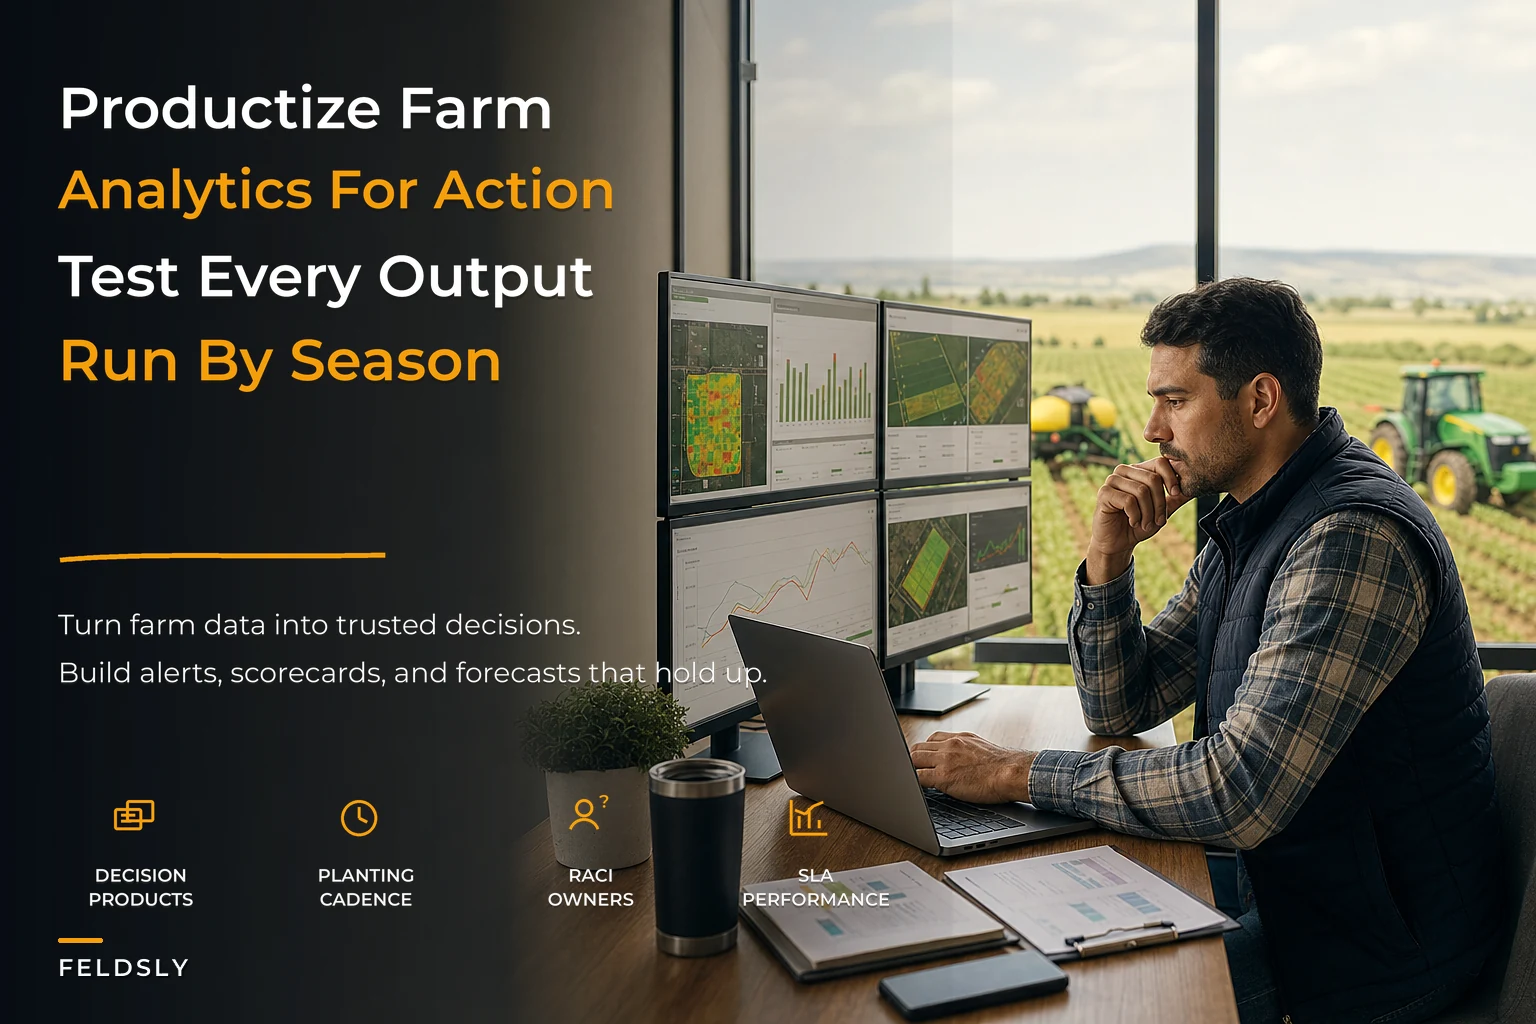
This piece breaks down three canonical products — alerts, field scorecards, and seasonal forecasts — and treats them the way you'd treat any other operational asset: with SLAs, RACI, and a rollback plan for when they break. Because they will break, usually at the worst time.
Why farm analytics falls apart (and it's not the math)
The common failure isn't bad models. It's that analytics gets treated as a reporting layer instead of an operational product with a job to do.
Here's the pattern. Someone — often the owner or a sharp agronomist — builds something useful during one season. A yield anomaly alert. A moisture-weighted field ranking. It works. Everyone loves it. Then the next season, the sensor vendor changes a firmware version, a field gets renamed in the FMS, a CSV export shifts a column, and the whole thing quietly produces garbage. Nobody notices until a decision gets made on bad numbers.
The deeper issue is that these three products have completely different failure modes, update frequencies, and tolerance for being wrong — but farms tend to build and govern all of them the same way. That's where coordination breaks.
-
Alerts need to fire fast and can tolerate some false positives, but a missed alert during a critical window is expensive.
-
Scorecards need to be consistent and comparable across fields and across seasons. A changed definition quietly ruins year-over-year comparisons.
-
Forecasts need to be honest about uncertainty. The danger here is false precision — a confident number that drives a six-figure input commitment.
Treat them identically and you get alerts nobody trusts, scorecards that aren't comparable, and forecasts that overstate confidence. The operating model exists to keep these three straight.
If you haven't already drawn a hard line between metrics that drive action and metrics that just look good in a review, that's the prerequisite work — the KPI and dashboard governance playbook covers that discipline directly, and this operating model assumes you've done it.
The three products, side by side
Before getting into each one, it helps to see them in contrast — because the governance choices flow directly from these differences.
Take control of your farm’s productivity.
Feldsly helps you plan, track, and optimize every farming operation with precision.
- Centralized crop scheduling
- Resource & labor management
- Real-time weather alerts
No credit card required
| Dimension | Alerts | Field Scorecards | Seasonal Forecasts |
|---|---|---|---|
| Primary job | Trigger fast action | Compare & rank fields | Support planning commitments |
| Update cadence | Real-time to hourly | Weekly / per growth stage | Monthly, tightening toward decision gates |
| Tolerance for error | False positives OK; misses costly | Must be consistent & comparable | Must express uncertainty, not hide it |
| Worst failure mode | Silent miss during a window | Definition drift ruins comparisons | False confidence drives bad commitment |
| Decision tied to | Immediate field response | Scouting priority, input allocation | Seed/input volume, labor, cash flow |
| Who acts on it | Crew lead / irrigation tech | Agronomist / field manager | Owner / operations + finance |
| Rollback trigger | Sensor dropout, alert storm | Source data gap, schema change | Input data staleness, model drift |
The table isn't the point — the point is that each column demands a different owner and a different definition of "working." Let's go through them.
Product 1: Alerts
Alerts are the only product on this list where latency is the whole value. A soil-moisture threshold breach you learn about three days later isn't an alert, it's a post-mortem.
What "working" means (acceptance tests)
-
Fires on known-bad data. Feed it a historical event where the condition was true (a documented dry-down, a frost night) and confirm it would have triggered.
-
Stays quiet on known-good data. Run it against a calm stretch and confirm it doesn't spam.
-
Survives a missing sensor gracefully. When a feed drops out, the alert for that field should either fail over to a secondary source or raise a data-health alert — not silently go dark.
-
Reaches a human within the SLA window. Test the full delivery path (SMS, push, whatever) end to end, not just the logic.
-
Dedupes. The same condition shouldn't fire 40 times in an hour. One alert, with an escalation if unacknowledged.
That third test is the one almost everyone skips, and it's the one that burns you. A silent sensor dropout looks exactly like "everything is fine." Your alert layer must treat absence of data as its own alert condition.
Rollback logic
-
Tier 1 Suppress the misbehaving rule, keep all other alerts live. Log the suppression with a timestamp and owner.
-
Tier 2 If the underlying data source is suspect (sensor network degraded), fall back to manual field checks on a fixed cadence until the source is re-validated.
-
Tier 3 Full manual mode — crew-led visual checks logged against the same fields. Slower, but you're never flying blind.
The trigger to roll back should be explicit: e.g. "More than X alerts from one rule in 60 minutes with no corroborating secondary signal → auto-suppress and notify the owner."
Sample SLA
| Alert class | Delivery target | Acknowledge within | Escalation if unacked |
|---|---|---|---|
| Critical (frost, irrigation failure) | Under 5 min | 15 min | Call owner + backup |
| High (moisture breach, pest threshold) | Under 15 min | 60 min | Secondary contact |
| Informational (trend drift) | Hourly batch | Same day | None |
Owner / RACI
-
Responsible Field tech or irrigation lead (acts on the alert)
-
Accountable Operations manager (owns that alerts fire correctly)
-
Consulted Agronomist (sets thresholds)
-
Informed Owner (critical class only)
The most common mistake here is making the person who receives alerts also the person accountable for the alert system working. Those are different jobs. The crew lead shouldn't be debugging a sensor feed during planting.
Product 2: Field scorecards
Scorecards are where farms accidentally destroy their own history. The product looks stable — same layout, same field names — but a quietly changed denominator or a mid-season metric redefinition means this year's "Field 7 score" and last year's aren't the same number anymore.
What a scorecard is actually for
Ranking and allocation. Which fields get scouting attention first. Where limited input budget earns the most. Which fields are quietly dragging the operation. If the scorecard isn't driving one of those decisions, it's decoration.
A workable scorecard blends a handful of comparable signals per field — yield vs. its own benchmark, input efficiency, a moisture or stress index, maybe a logistics/distance factor at harvest. The exact weights matter less than keeping them frozen within a season so comparisons hold.
Acceptance tests
-
Reproducible Re-running the scorecard on the same input data produces the same ranking. Sounds obvious; fails constantly when live feeds sneak into "historical" calculations.
-
Definition-locked Every metric has a written definition and a version number. Changing a weight mid-season creates a new version, with the change logged.
-
Comparable across fields Normalized so a 40-acre field and a 180-acre field can sit on the same ranking without the big field always winning on raw volume.
-
Handles missing inputs explicitly A field with a dead sensor shows as incomplete, not as a falsely low score.
Rollback logic
-
If a source feed changes schema or goes stale, quarantine the affected metric and show the scorecard with that component greyed out rather than silently zeroed.
-
If a definition change produces a ranking shift of more than a set threshold overnight, freeze the new version and revert to the last validated one until someone signs off.
-
Keep the prior validated version always retrievable. You will need to explain to yourself in August why a field's score moved.
Cadence
| Activity | Cadence | Owner |
|---|---|---|
| Score refresh | Weekly in-season | Analyst / agronomist |
| Definition review | Pre-season + mid-season | Operations manager |
| Field manager walkthrough | Weekly | Field manager |
| Version audit | End of season | Owner + analyst |
Sample SLA & RACI
-
Refresh SLA Updated scorecard available by Monday 7 a.m. each in-season week.
-
Responsible Analyst or agronomist who maintains it
-
Accountable Operations manager
-
Consulted Field managers (sanity-check against what they're seeing on the ground)
-
Informed Owner
One field pattern worth naming: scorecards that disagree with experienced field managers get ignored, not investigated. When a manager says "that score's wrong, Field 12 is fine," that's a test case, not a nuisance. Log it. Nine times out of ten it exposes a data issue you'd otherwise ship into a planting decision. This is exactly where good agronomy context has to feed the numbers — the operational agronomy integration playbook goes deeper on keeping agronomic reality and the data layer in sync.
Product 3: Seasonal forecasts
Forecasts are the highest-stakes and the easiest to misuse, because a single confident number can anchor a six-figure input or seed commitment. The job of a forecast product isn't to be right — it's to be honest about how right it's likely to be.
What "working" means
-
Calibrated uncertainty. Backtest against prior seasons — when the model said "80% confidence," was it actually right around 80% of the time? An overconfident forecast is worse than no forecast.
-
Tightens toward decision gates. The range should narrow as you approach the planting or input-commitment date. If it's just as wide the week of the decision as it was two months out, it isn't earning its keep.
-
Decomposable. You can see why the number is what it is — which inputs move it most. A black-box number nobody can interrogate won't survive a disagreement.
-
Stale-data aware. If a key input (soil moisture, a weather feed) is out of date, the forecast flags it rather than quietly projecting on old data.
Rollback logic
-
Model drift If backtested accuracy degrades below threshold, revert to the prior model version or to a simpler baseline (historical average by field) and flag that you've done so.
-
Input staleness If feeds driving the forecast are stale beyond a set age, mark the forecast provisional and widen the stated range rather than publishing a clean-looking point estimate.
-
Baseline fallback Always keep a dumb-but-reliable baseline available. A naive historical average you can defend beats a sophisticated model you can't trust during a commitment decision.
Cadence tied to the calendar
| Season phase | Forecast cadence | Decision it feeds |
|---|---|---|
| Pre-season (90–60 days out) | Monthly | Seed selection, input volume, acreage mix |
| Pre-plant (30 days out) | Biweekly | Final input commitments, labor plan |
| In-season (emergence→grain fill) | Weekly | In-season input adjustments, scouting focus |
| Pre-harvest (30 days out) | Weekly, tightening | Harvest sequencing, drying/logistics, labor |
| Harvest | As-needed | Field order, moisture-driven prioritization |
Owner / RACI
-
Responsible Analyst / data owner
-
Accountable Owner or operations lead (they're the ones committing money against it)
-
Consulted Agronomist, finance
-
Informed Field managers
The forecast is the one product where finance belongs in the room, because its output converts directly into cash commitments and buffer decisions.
How the three products connect
These aren't three separate tools — they're one pipeline, and the handoffs are where value is created or lost.
Alerts catch the real-time events. Those events feed into the scorecard as this week's signal — a field that threw three moisture alerts this week should move in the ranking. The scorecard's cross-field picture, in turn, becomes an input to the forecast: persistent underperformance in a cluster of fields should widen your yield range and change your input commitments. Then the forecast's decision gates loop back and reset alert thresholds for the next phase.
When this pipeline works, a 5 a.m. irrigation alert in June eventually shows up as a tighter, better-informed input commitment in the forecast — because the same field-level reality flowed through all three products instead of dying in a dashboard nobody checked.
A simple workflow diagram can make the handoffs obvious.
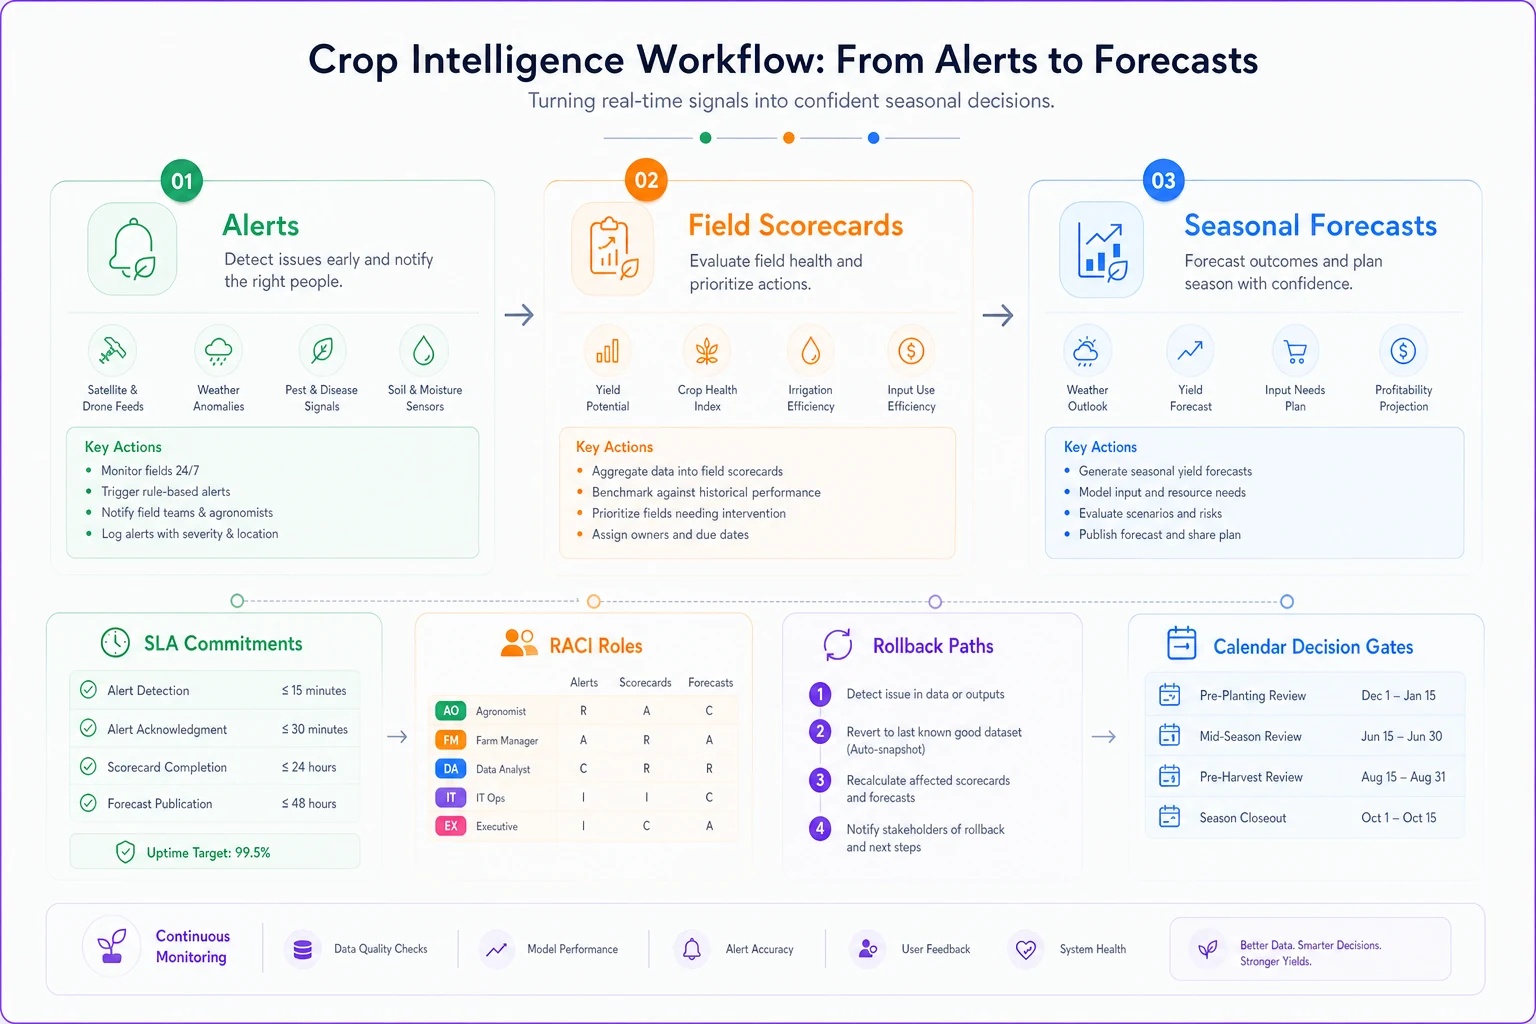
When it breaks, it's almost always at a handoff:
-
Alerts fire but never update the scorecard (the signal dies).
-
Scorecards update but aren't trusted, so forecasts rely on gut (the comparison is wasted).
-
Forecasts drive commitments but never reset alert thresholds for the new phase (you're monitoring for last month's risks).
Fixing the handoffs matters more than improving any single model.
A real scenario
A roughly 2,800-acre corn and soybean operation across about a dozen fields had all three products in some form — a moisture alert setup, a homemade field-ranking spreadsheet, and a yield forecast the owner updated "when he got to it."
The problem wasn't the quality of any one piece. It was that they didn't connect, and nobody owned reliability. Two sensors had been dead for most of the previous season and nobody noticed, because dead sensors just stopped producing alerts — the silence read as calm. Those two fields sat in the scorecard with stale scores, and the forecast carried an overconfident number into a pre-plant input commitment.
The fix wasn't fancier analytics. It was:
-
Making data absence its own alert class (so a dead sensor screams instead of going quiet).
-
Freezing scorecard definitions for the season and versioning them.
-
Tying the forecast cadence to actual decision gates, and forcing it to widen the range when inputs went stale.
-
Assigning one person as accountable for each product working — separate from whoever acts on it.
Rough outcome over the following season: the two silent-sensor blind spots got caught within days instead of months, input commitments on two fields were revised down before the money went out (a meaningful mid-five-figure avoidance), and — maybe more telling — the field managers actually started trusting the scorecard enough to argue with it, which is when a scorecard becomes useful.
No new sensors. Same models, mostly. The gain came from the operating model around the analytics, not the analytics themselves.
When this makes sense — and when it doesn't
This makes sense when:
-
You're running multiple fields where decisions can't all live in one person's head.
-
You've already got data flowing (sensors, FMS, yield monitors) but don't trust it under pressure.
-
Input and seed commitments are large enough that a bad forecast costs real money.
This is overkill when:
-
You're a single operator on a handful of fields who can walk every acre. The coordination overhead outweighs the benefit — a notebook beats a RACI chart at that scale.
-
Your data foundation isn't there yet. Formalizing analytics products on top of unreliable, ungoverned data just makes bad numbers look official. Fix the foundation first — the sequencing in staged data governance is the right order of operations before you layer products on top.
Who should hold off entirely: anyone treating this as a dashboard project. If the output is prettier charts rather than faster, more trusted decisions, you've built a reporting layer, not an operating model, and it'll quietly rot the same way the last one did.
Downloadable playbook templates
To actually run this, you want the artifacts, not just the concepts. The ones worth building for each product:
-
Alert spec sheet — per-rule
trigger condition, data source, SLA, acknowledge/escalation path, rollback trigger, owner.
-
Scorecard definition register — every metric, its formula, weight, version number, and change log.
-
Forecast decision-gate calendar — mapped to your planting and harvest dates, with the cadence and the specific commitment each update feeds.
-
RACI one-pager — all three products on a single sheet so handoffs are visible.
-
Rollback runbook — the tiered fallbacks for each product, written down before the season, so nobody's improvising at 5 a.m.
Keep these as living documents reviewed pre-season and mid-season. The version history is the point — in August, when you're trying to understand why a number moved, the change log is what saves you.
The real takeaway
Analytics on a farm doesn't fail because the models are wrong. It fails because nobody owns whether they keep working, the three products get governed as if they're the same thing, and the handoffs between them leak. A dead sensor reads as calm, a quietly redefined scorecard ruins a year of comparisons, and a confident-looking forecast walks real money out the door.
The fix is unglamorous: define each product, test it against what "working" actually means, write down how it rolls back when it breaks, and name one person accountable for each — separate from whoever acts on the output. Tie the whole thing to your real planting and harvest calendar so the cadence matches the decisions, not an arbitrary monthly rhythm.
Do that, and the payoff isn't a better dashboard. It's that when the window is narrow and the call has to happen now, you actually trust the number in front of you. That trust — built on acceptance tests, rollback plans, and clear ownership — is the whole point of having an operating model instead of a pile of spreadsheets.
Ready to revolutionize your farm management?
Join 500+ farms using Feldsly to boost yields, reduce waste, and streamline daily farm workflows.