
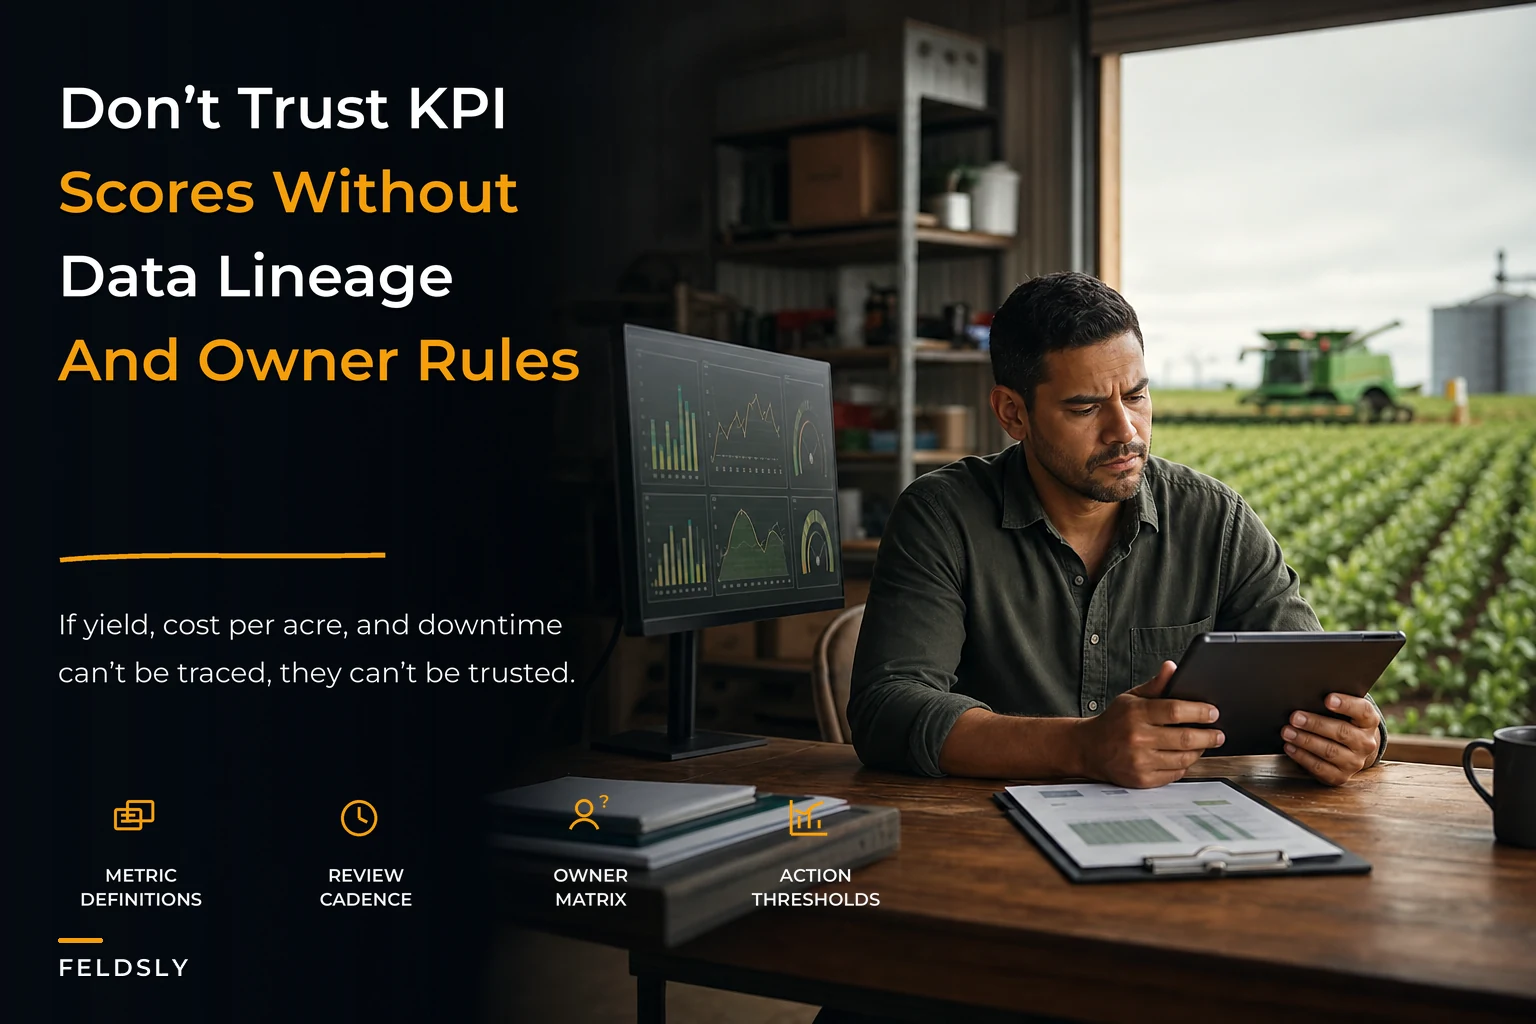

There's a specific kind of dashboard I've come to distrust. It's the one hanging on a monitor in the farm office, full of green gauges and rising line charts, that nobody has actually used to make a decision in the last two seasons. It looks like control. It isn't. It's decoration.
The problem with most farm KPIs isn't that they're wrong. It's that nobody agreed on what they mean, where the number comes from, or what anyone is supposed to do when it moves. You end up with three people quoting three different "yields" for the same field, a cost-per-acre figure that changes depending on who ran the report, and downtime numbers that only exist in someone's memory. That's not a measurement problem. That's a governance problem.
This is the part of operational KPI dashboard governance on a farm that almost nobody sets up properly. Everyone wants the dashboard. Very few want to do the boring work underneath it — defining the metric, tracing where the data comes from, deciding the threshold that triggers action, and naming the person accountable when it does. That boring work is the whole game.
Why farm metrics quietly drift into nonsense
Here's the pattern that shows up on operations of almost every size once they grow past a couple hundred acres.
Early on, one person knows everything. They know that "yield" means the grain cart scale total divided by the field's planted acres, adjusted to 15% moisture. They know that "cost per acre" for a given field includes seed, chemical, and their own labor but not the pickup truck's fuel or the land payment. It's all in their head, and it's internally consistent because it's one head.
Then the operation grows. A second manager comes on. An agronomist starts pulling data. The accountant builds a spreadsheet. Suddenly there are four versions of every number, and each is technically defensible.
-
The agronomist's yield is from the yield monitor, uncalibrated.
-
The manager's yield is from the elevator scale tickets.
-
The accountant's yield is bushels sold, which excludes what's still in the bin.
-
The owner's yield is "what it felt like."
None of them are lying. They're using different sources for the same word. And when you put all four into one dashboard, the dashboard becomes untrustworthy the first time two numbers disagree in a meeting. Once people stop trusting a dashboard, they stop using it, and you're back to gut feel with extra steps.
The deeper issue is that a farm isn't one workflow. It's planting, spraying, harvest, grain handling, equipment, labor, and finance all overlapping, each generating its own data with its own quirks. Without a shared definition layer, every one of those workflows produces numbers that don't reconcile with the others.
The three metrics worth governing first
You don't need forty KPIs. On a crop operation, three metrics carry most of the weight, and if you govern only these well you're ahead of most farms twice your size: yield, cost per acre, and downtime.
Take control of your farm’s productivity.
Feldsly helps you plan, track, and optimize every farming operation with precision.
- Centralized crop scheduling
- Resource & labor management
- Real-time weather alerts
No credit card required
The point of "governing" them is that each one gets a single canonical definition everyone uses. Here's what that actually looks like when you write it down instead of leaving it in someone's head.
| Metric | Canonical definition | Data source (single source of truth) | Common way it gets faked |
|---|---|---|---|
| Yield (bu/ac) | Calibrated yield-monitor total, moisture-adjusted to standard, divided by planted acres (not field acres) | Yield monitor, reconciled against scale tickets at season close | Using field acres instead of planted; ignoring moisture; uncalibrated monitor |
| Cost per acre | All directly attributable input + operating cost for that field, this crop year, excluding fixed land/overhead | Accounting system tagged by field + crop year | Mixing in overhead so fields can't be compared; missing labor |
| Downtime (hrs) | Hours a machine was scheduled to run but couldn't, logged at the moment it happens | Operator log or telematics, captured same-day | Reconstructed from memory weeks later; only "big" breakdowns counted |
The right-hand column matters more than the definition itself. Every one of those "faked" versions produces a number that looks fine on a dashboard and is quietly useless for decisions. A yield figure using field acres instead of planted acres will make your worst-drained fields look better than they are, because you're spreading the same bushels over drowned-out corners you never planted.
Data lineage, but the minimal version
"Data lineage" sounds like enterprise software jargon, and most farms hear it and check out. Keep it simple. For each governed metric, you only need to answer four questions on a single line:
-
Where does the raw number originate? (grain cart scale, telematics, invoice)
-
Who or what touches it before it hits the dashboard? (operator logs it, office keys it in, software pulls it)
-
When does it get locked? (same-day, week-end reconciliation, season close)
-
What's it checked against? (scale tickets, bank statement, second reading)
A typical example for downtime looks like this: originates at the machine → operator logs hours same-day in the field app → office reviews weekly → checked against telematics engine hours. That one sentence tells you exactly where the number can go wrong, which is the whole reason lineage exists.
Where operations get burned is step two — the hand-offs. Every time a number gets re-keyed from a paper log into a spreadsheet, you introduce a place for it to drift. The farms with the cleanest dashboards aren't the ones with the fanciest tech. They're the ones with the fewest hands between the event and the record.
Here's a simple workflow illustration.
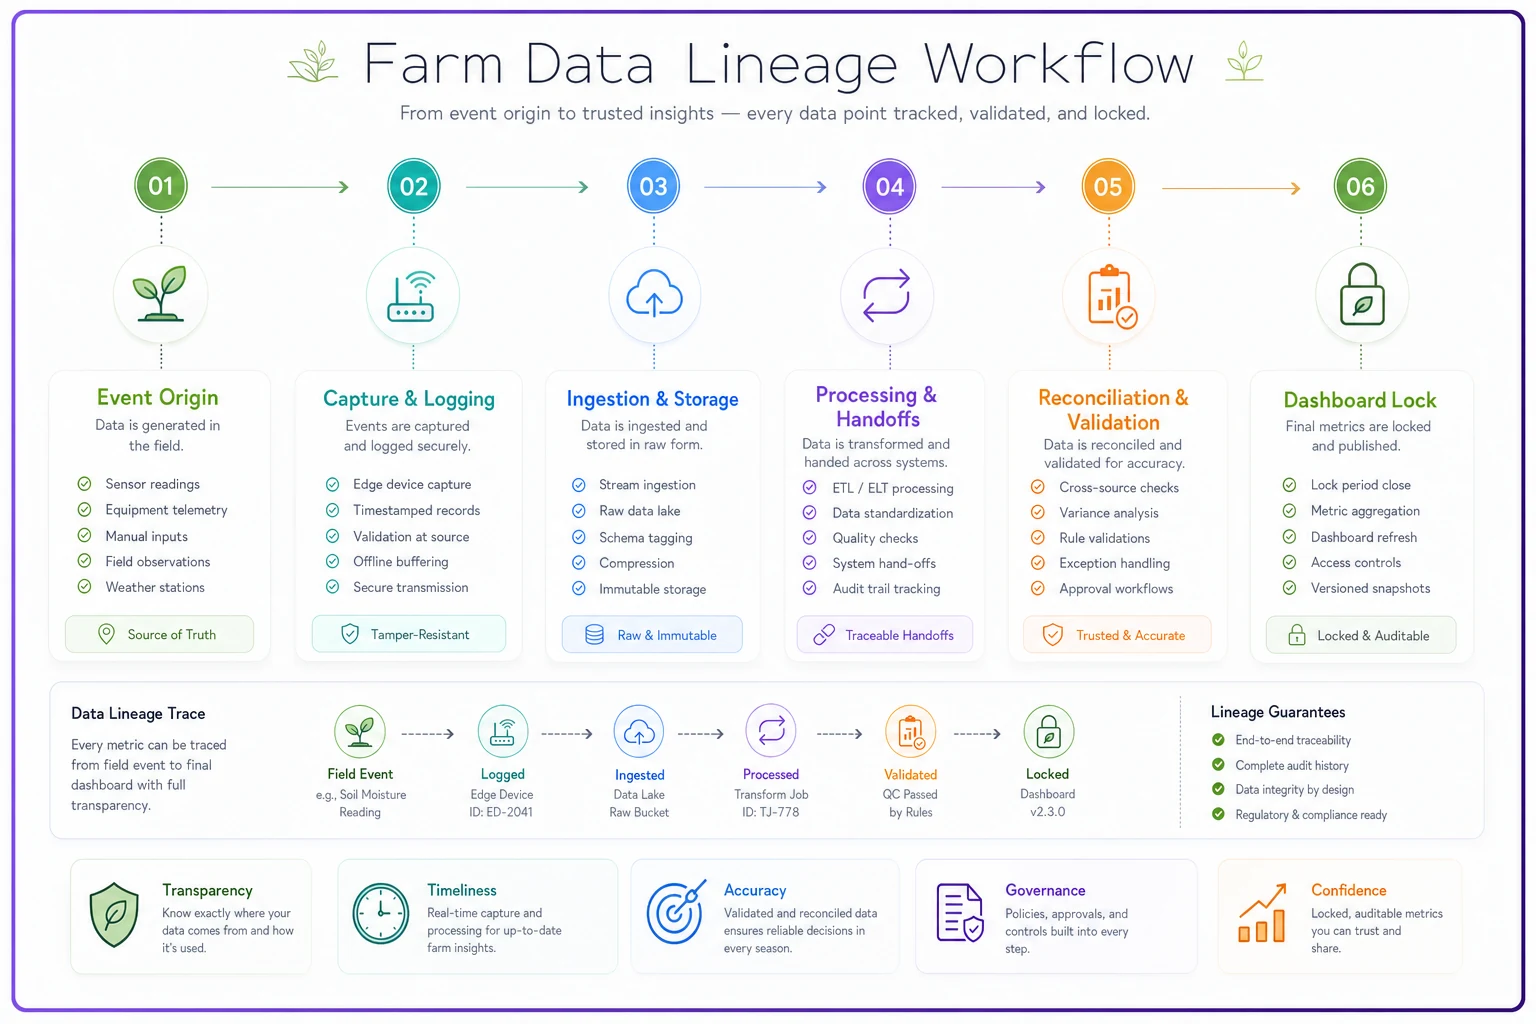
Have operators log events same-day in the field app to cut re-keying and avoid drift.
Cutting re-keying is where staged automation genuinely earns its place, and it's a big part of why staged data governance unlocks ROI for AI on mid-size and large farms — the value isn't the AI, it's that the data underneath finally holds together.
Thresholds are where dashboards become decisions
A metric with no threshold is just a number to stare at. This is the single biggest failure: farms track things carefully and never define the line that says "now act."
A threshold-to-action mapping ties each metric to a specific trigger and a specific response. Not "monitor closely." An actual action with an owner.
-
Yield field comes in more than roughly 12–15% below its 3-year adjusted average → agronomist opens a scouting/soil review within 10 days, before the memory of the season fades. (This is the same logic behind yield benchmarks and simple anomaly alerts to prioritize scouting — the threshold is what turns a benchmark into a to-do.)
-
Cost per acre any field runs more than around $40–60/ac over its crop-type budget → operations manager reviews input logs for that field within the week.
-
Downtime any single machine logs more than roughly 8 hours unplanned downtime in a peak week → maintenance lead flags for lifecycle review at month end.
Notice the ranges instead of hard single numbers. On a real farm the exact threshold depends on your crop, region, and equipment age, and pretending you know it to the decimal is its own kind of vanity metric. Pick a band, watch it a season, tighten it.
The mistake people make here is setting thresholds so sensitive that everything trips and every alert gets ignored — or so loose that nothing ever trips and the dashboard just confirms you're doing great right up until you aren't. The first year of thresholds is calibration, not gospel.
Nobody owns it, so nobody fixes it
You can have perfect definitions, clean lineage, and sensible thresholds, and the whole thing still dies if there's no name attached to each metric. "The team" owning a KPI means nobody owns it.
An owner-accountability matrix is a small, unglamorous table that answers: for each metric, who's responsible for the number being correct, and who's responsible for acting when it crosses a threshold? Those are often two different people, which is exactly why it gets muddy.
| Metric | Data owner (accuracy) | Action owner (response) | Reviewed |
|---|---|---|---|
| Yield | Agronomist | Ops manager + agronomist | Post-harvest |
| Cost per acre | Office / bookkeeper | Ops manager | Monthly |
| Downtime | Maintenance lead | Maintenance lead | Weekly in season |
The split between data owner and action owner is worth sitting with. Your bookkeeper can be responsible for cost-per-acre being accurate without being responsible for doing anything about a field that's over budget — that's an operations call. When those two roles collapse into one vague "whoever notices," things quietly rot, because the person best positioned to spot the problem often isn't the person who can fix it.
Review cadence: the rhythm that keeps it alive
Governance isn't a document you write once. It's a schedule. Different metrics move at different speeds, and reviewing them all monthly is as broken as reviewing them all daily.
-
Weekly, in season downtime and anything time-sensitive. These decay fast — a breakdown you don't log this week is gone.
-
Monthly cost per acre against budget, so you catch drift while you can still change purchasing.
-
Post-harvest / season close yield reconciliation and a full review of the definitions themselves.
That last one gets skipped constantly. Once a year you should re-open the definitions and ask whether they still match how you actually operate. Farms change — you rent new ground, you switch a monitor, you add a crop — and a definition written three seasons ago slowly stops describing reality.
A dashboard built on a stale definition is worse than no dashboard, because it looks authoritative while quietly lying to you.
When this level of governance actually makes sense — and when it doesn't
This isn't for everyone, and it's worth saying that upfront.
When it makes sense: you're past the point where one person holds all the numbers in their head, you've got multiple people pulling data, and you've already had at least one meeting where two "true" numbers disagreed. Roughly, that's operations where more than one manager touches decisions.
When it's overkill: a tight single-operator or family operation where the same person plants, sprays, harvests, and does the books. Formal lineage tables and accountability matrices there are bureaucracy for its own sake. Keep the definitions in your head; you already reconcile them automatically.
Who should NOT do this: anyone hoping the framework fixes a trust problem between partners. If two owners disagree on strategy, governing the metrics won't resolve it — it'll just give them cleaner numbers to argue about. Sort the human problem first.
A real scenario
A corn-and-soybean operation running around 3,400 acres across a dozen leased and owned parcels had three different yield numbers floating around every fall and a running argument about which fields were actually losing money. Their dashboard existed — it just quietly contradicted itself, so decisions defaulted to the owner's gut.
They didn't buy new sensors. They spent about two weeks before spring writing one canonical definition per core metric, a four-line lineage note for each, and a one-page accountability matrix. Downtime went from "remembered at month-end" to logged same-day by whoever was on the machine.
The payoff wasn't dramatic on paper, and anyone claiming otherwise is probably selling something. What changed: two underperforming rented parcels that had been hiding behind field-acre yield math showed up clearly as losers, and they dropped one lease the following year — call it a few thousand dollars of avoided loss on that parcel alone. More importantly, the fall yield argument stopped happening, because everyone was finally quoting the same number. That second thing is harder to price and probably worth more.
The through-line
Vanity metrics aren't a display problem you fix with a nicer chart. They come from skipping the definition, the lineage, the threshold, and the owner — the four unglamorous things that turn a number into a decision.
Get those right on just yield, cost per acre, and downtime, and you'll have a dashboard people actually argue from instead of about.
If you're also using these numbers to make planting and financial calls, they need to feed cleanly into your planning process — which is where consistent definitions pay off again, and part of why operational financial scenario planning for commodity crops only works when the inputs are trustworthy in the first place. Governance isn't the exciting part of running a farm. It's just the part that decides whether every other decision is built on real ground or on a green gauge that means nothing.
Ready to revolutionize your farm management?
Join 500+ farms using Feldsly to boost yields, reduce waste, and streamline daily farm workflows.