
Last month I watched a farm manager in central Illinois walk through his scouting records. Three clipboards, dozens of sticky notes, and a whiteboard with field numbers scrawled everywhere. "We scout based on gut feel and whatever looks off from the road," he told me. Two weeks later, they found a 40-acre section with severe nitrogen deficiency that had been struggling for weeks. The damage? About 35 bushels per acre below what that field normally produces.
You see this constantly. Not because managers are lazy, but because tracking performance across dozens of fields simultaneously is impossible for human brains. You'll catch the obvious yellow patches or storm damage, but what about that field consistently running 8% below normal? Or sections performing differently than similar soil zones?
Most operations exist in this weird middle ground between pure guesswork and expensive precision ag platforms that need dedicated analysts. There's this huge gap where simple, systematic tracking would catch problems weeks earlier.
Why traditional scouting misses gradual performance shifts
The agriculture tech companies want you to believe yield anomaly detection requires satellites and machine learning. But honestly? The real problem isn't detecting tiny variations — it's catching obvious problems hiding in plain sight.
Traditional scouting follows predictable patterns. Check fields after storms. Walk problem areas from last year. Respond to what drivers notice from the cab. Maybe you have a rotation schedule, but it's usually based on convenience rather than actual performance data.
Scale makes this exponentially harder. A 2,000-acre operation might have 15-20 distinct management zones across different fields. Each zone has its own baseline performance, soil characteristics, vulnerability patterns. Your crew can't mentally track whether Field 7's northwest corner typically yields 180 or 195 bushels. They definitely can't remember if that 15-bushel gap is normal or an emerging problem.
Weather adds another layer of complexity. After dry spells, which fields recover quickly? Which need immediate intervention? Without baseline comparisons, every field looks equally stressed. You either scout everything (impossible) or guess at priorities (expensive).
Most farms already collect the data needed. Yield monitors, soil tests, application records — it's all there. But scattered across different systems, different formats, making comparison nearly impossible during the growing season when timing actually matters.
The hidden cost structure of reactive scouting
Here's a typical scenario: You're managing 1,800 acres of corn across 12 fields. Field 8 starts showing root disease signs in week 6, but subtle — maybe 5% below expected growth. Your crew doesn't flag it because the variation seems normal. By week 10, visual symptoms become obvious, but you've missed the intervention window. The problem spreads from 50 acres to 120 acres, dropping from potential 190 bu/ac to around 165 bu/ac.
Take control of your farm’s productivity.
Feldsly helps you plan, track, and optimize every farming operation with precision.
- Centralized crop scheduling
- Resource & labor management
- Real-time weather alerts
No credit card required
Immediate loss: 3,000 bushels at $4.50 per bushel = $13,500.
But that's just the start. Now you need emergency scouting across all fields checking for similar issues. Your agronomist's entire week gets redirected. If you find problems, you're paying premium prices for late-season treatments. Harvest planning gets disrupted because Field 8 now has different moisture levels and quality issues. You might need separate storage or face dockage at the elevator.
Labor inefficiency multiplies everything. Instead of targeted scouting based on performance data, your crew does panic sweeps. They're checking healthy fields while missing emerging problems elsewhere. One operation in Iowa calculated their "crisis scouting" cost roughly $45 per acre in labor and delayed interventions across their entire farm.
The planning cascade affects next year too. Seed selection, fertilizer programs, rotation decisions all get clouded because you don't know if Field 8's problem was environmental, biological, or management-related. You might overcompensate with expensive inputs or miss the real issue entirely.
Building baselines without the complexity
Forget about real-time satellite analysis and predictive algorithms for now. Start with simple historical baselines that flag obvious deviations.
Take each field's last three years of yield data. Calculate the average and standard deviation. That's your baseline. During the season, use visual assessments, drone surveys, or sample measurements to estimate current performance. Any field tracking more than 10% below its baseline gets flagged for detailed scouting.
Here's a simple workflow visualization.
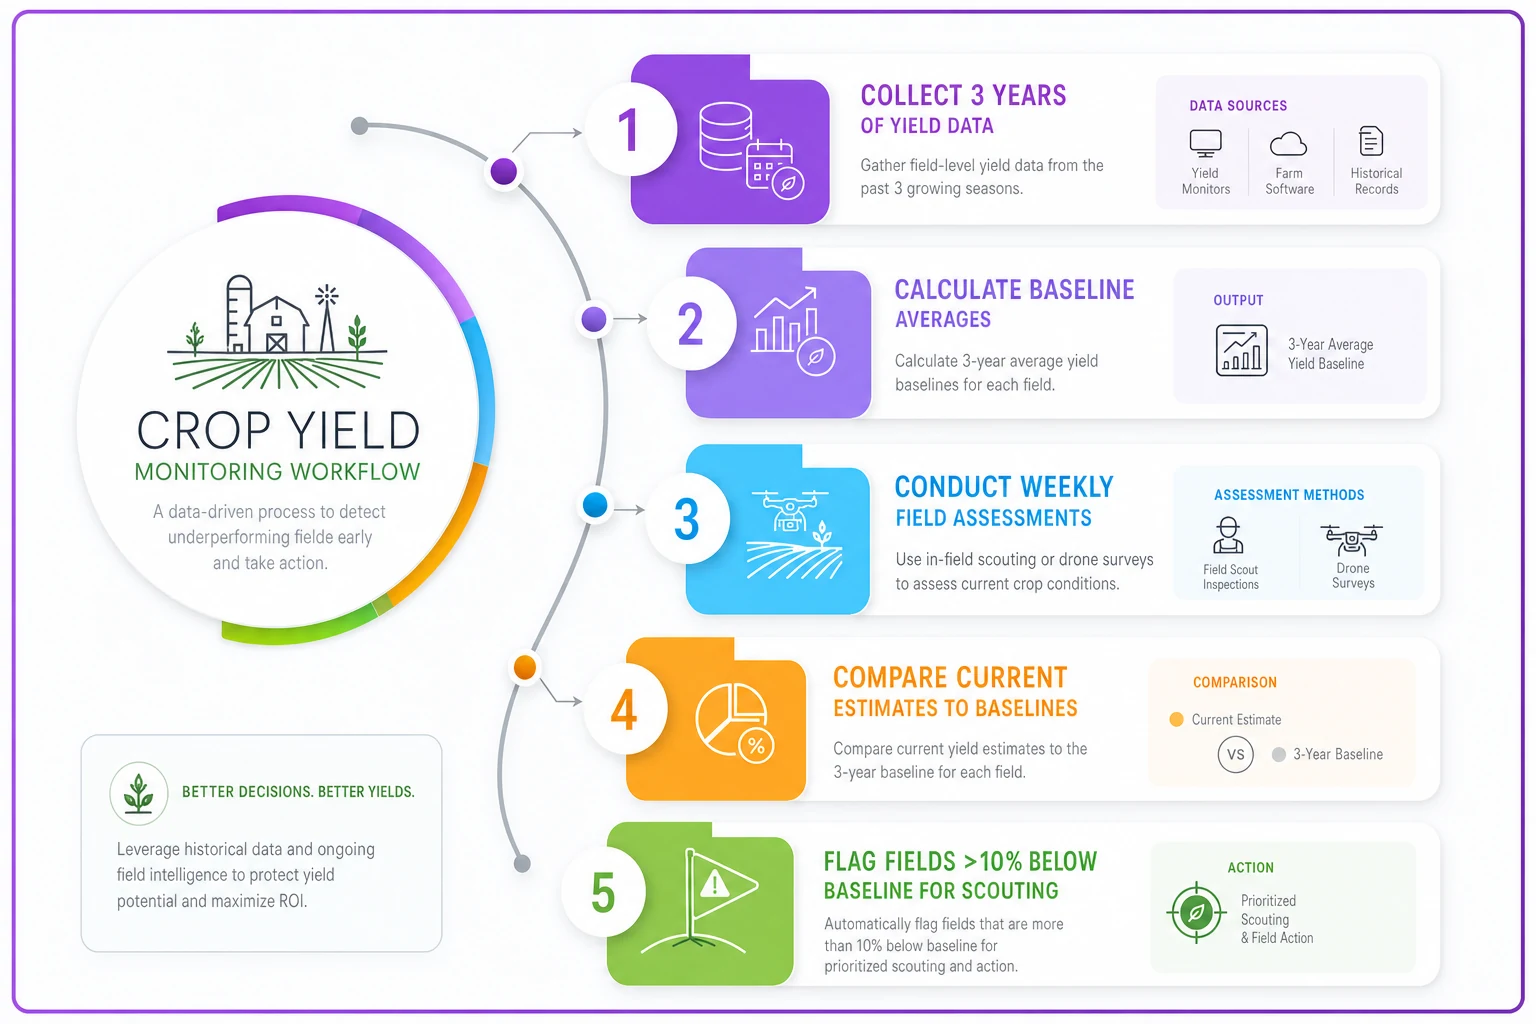
A wheat operation near Topeka started this with basic spreadsheets. They divided fields into 40-acre management zones and assigned each zone a three-year average yield. Their supervisor spent two hours weekly updating estimated performance based on quick field tours. No fancy sensors, just experienced eyes comparing current growth to historical norms.
First season, they caught a drainage issue affecting 80 acres three weeks earlier than usual. The intervention cost $3,200 in tile repair and recovered roughly 15 bushels per acre — $5,400 return on a few hours of spreadsheet work.
Manual tracking hits limits fast though. Spreadsheets become unwieldy beyond 20-30 management zones. Updates get skipped during busy periods. Deviation calculations become inconsistent when different people handle updates.
This is where AI-powered operational software makes sense. Instead of manual calculations, the system automatically compares current observations against historical baselines. When scouts input field conditions — even rough estimates — it immediately flags deviations. No statistics background required.
The key is keeping it simple enough that people actually use it. Complex models might be more accurate, but a basic system used consistently beats a sophisticated one abandoned after two weeks.
The weekly prioritization report that actually gets read
Reports kill most anomaly detection systems. They generate 40-page documents full of charts nobody has time to interpret during planting or harvest. You need something taking 30 seconds to understand that directly drives Monday morning scouting assignments.
Format that works:
Priority 1 - Immediate Scouting Required
-
Field 7 North
-18% vs baseline (historical avg: 185 bu/ac)
-
Field 12
-15% vs baseline (historical avg: 172 bu/ac)
-
Field 3 East
Moisture stress indicators + -12% growth
Priority 2 - Scout Within 48 Hours
-
Field 9
-9% vs baseline, adjacent to Field 7 North
-
Field 15 South
Unusual growth pattern, needs verification
Already Addressed - Continue Monitoring
-
Field 4
Fungicide applied 6/15, recovering
-
Field 11 West
Replanted section, expected lower yield
No Action Required - On Track
-
8 fields within normal range
One page, clear priorities, specific enough to drive decisions but simple enough to process during morning coffee.
Include context that matters. Not just "Field 7 is underperforming" but "Field 7 North is -18% vs baseline and adjacent to last year's disease pressure zone." This helps scouts know what to look for and prevents wild goose chases.
Some operations add simple maps with color coding — red for immediate attention, yellow for monitoring, green for on-track. Even this can be overkill though. The simpler the report, the more likely it gets used consistently.
Generate reports Thursday evening for Friday planning meetings. This gives time to schedule scouting for Monday and Tuesday when crews are fresh. Monday morning reports create panic without time for thoughtful response.
Deviation thresholds that match your operation
Standard deviation sounds like statistics class, but it's just asking "how much variation is normal?" A field usually ranging from 170-190 bushels has different "normal" variation than one consistently hitting 185-187 bushels.
| Level | Criteria |
|---|---|
| Alert Level (Yellow) | 8-10% below baseline or 1.5 standard deviations. Catches emerging issues before they become critical. Might just add these fields to next week's regular scouting rotation. |
| Action Level (Orange) | 12-15% below baseline or 2 standard deviations. These fields need scouting within 48 hours. Something's definitely wrong, but you might still have intervention options. |
| Critical Level (Red) | Beyond 15% below baseline or 2.5 standard deviations. Scout immediately and prepare for yield loss. Focus on preventing spread and planning harvest adjustments. |
Adjust thresholds based on response capacity. If you can only scout two fields per day, tighter thresholds just create stress without actionable outcomes. Start with wider thresholds and tighten as response capacity improves.
Growth stage affects thresholds too. Early season, when interventions are cheaper and more effective, use tighter thresholds. A 10% deviation in V6 corn might be correctable with side-dress nitrogen. Same deviation at R3 is just information for next year.
Crop type matters. High-value vegetables might justify 5% thresholds given intervention returns. Commodity grains might only make sense at 12-15% where the intervention cost-benefit clearly pencils out.
Setting up tracking without disrupting operations
Trying to change everything at once is the biggest implementation failure. Successful farms phase in anomaly tracking gradually, usually starting with highest-value or most problematic fields.
Start with historical data collection. Pull three years of yield maps, even if imperfect. Calculate simple averages for each field or management zone. Takes a day for most operations and provides your baseline foundation.
Next, establish observation routines that don't require special trips. Equipment operators already crossing fields can do visual ratings. "Field looks normal," "slightly behind," or "definitely struggling" is enough to start. These rough categories translate to 0%, -5%, and -15% adjustments from baseline.
A vegetable operation in Salinas started even simpler. Harvest crews already tracked daily yields by field section. They just added a comparison to the three-year average on collection sheets. Red pen for anything 10% below average. Within two weeks, they identified irrigation inconsistencies affecting 20% of their acreage.
Add a baseline comparison field to existing harvest or collection sheets so crews can flag sections 10% below average without adding new workflows.
Basic spreadsheets work for under 500 acres. Phone apps with simple forms handle data collection. Automation comes from templates and formulas, not expensive software initially.
Training takes one morning. Show crews what "normal" looks like for each growth stage. Give them photos of 10% and 20% reduced stands or growth. Most experienced operators already have this intuition — you're just systematizing their observations.
Integration with existing workflows matters. If scouts already use paper forms, add a baseline comparison field. If you do weekly drive-throughs, add a simple rating system. Less change required means more consistent data collection.
When visual estimates beat sensor networks
This might sound backwards, but visual estimates often outperform sensor networks for practical anomaly detection, especially in early seasons.
Sensors provide precision but require calibration, maintenance, and interpretation. A soil moisture probe showing 15% volumetric water content — what does that mean for Field 7's specific soil type and crop stage? You need baseline data for each sensor location, adjustment factors for soil variation, and someone understanding the nuances.
An experienced operator can look at a field and immediately know it's "about 10% behind where it should be." They're unconsciously integrating dozens of factors — plant height, color, stand consistency, leaf angle — into one assessment. That holistic evaluation often catches problems single-point sensors miss.
Visual estimates scale better initially too. Adding a new field just requires someone familiar with its normal appearance. Adding sensors means purchase, installation, calibration, network setup — often $500-1,000 per monitoring point.
The sweet spot combines both approaches strategically. Use visual estimates for broad monitoring across all fields. Deploy sensors in high-value areas or fields with recurring problems. This gives coverage without overwhelming cost or complexity.
Making the system sustainable through seasons
Most anomaly detection systems die during busy periods. Planting and harvest create operational overload right when monitoring matters most. Systems need to survive these pressure points.
Build redundancy into data collection. If the farm manager usually does ratings, have equipment operators trained as backup. If one person handles weekly reports, create templates others can run. During harvest in 2022, an Illinois operation maintained tracking only because they'd cross-trained their scale operator to generate reports while trucks were being weighed.
Simplify during peak periods. Maybe skip detailed zones and just track field-level performance. Maybe reports go from weekly to bi-weekly. The goal is maintaining some tracking rather than perfect tracking.
Create clear handoff protocols between seasons. Who updates baseline yields after harvest? Who reviews thresholds before planting? Who trains new scouts on the rating system? Without explicit ownership, these tasks get forgotten until problems emerge.
Document everything simply. Not 50-page manuals, but one-page references. "How to rate field performance." "How to run the weekly report." "What the thresholds mean." Keep these where people actually look — break room wall, not dusty binders.
Review the system each winter. Spend two hours reviewing whether thresholds caught problems appropriately. Were there false alarms that wasted scouting time? Did you miss issues that should have been flagged? Adjust accordingly.
Some farms tie anomaly tracking to existing meetings. Wednesday morning coffee becomes Wednesday morning field review. Friday parts run becomes Friday scouting assignment. Embedded systems survive; add-on systems don't.
The compound effect of consistent anomaly tracking
After two seasons of systematic tracking, benefits compound beyond just catching problems earlier. You start seeing patterns invisible in single-year data.
That corner of Field 7 that consistently underperforms? Maybe it's not worth the same input investment. The section bouncing back quickly from stress? Perhaps it justifies premium seed varieties. These insights only emerge from consistent deviation tracking over time.
A cotton operation near Lubbock discovered certain fields consistently showed 12% yield deviation in dry years but performed normally in wet years. They adjusted irrigation priorities and insurance strategies accordingly, saving roughly $30,000 annually in over-irrigation of resilient fields.
The historical database becomes invaluable for decision-making. Considering new irrigation pivots? You know exactly which fields show the most weather-related variation. Evaluating seed varieties? You can see which fields consistently hit or miss their genetic potential.
Labor efficiency improves dramatically. Scouts stop wasting time on stable fields and focus on genuine problem areas. The "expertise" of knowing which fields to watch becomes embedded in the system rather than retiring with senior employees.
Communication with agronomists and consultants improves too. Instead of vague concerns about Field 12, you're discussing specific deviation patterns and historical recovery rates. This leads to better recommendations and more targeted solutions.
The psychological benefit shouldn't be ignored either. Operations managers sleep better knowing they have systematic monitoring rather than hoping problems reveal themselves in time. Stress reduction alone justifies the minimal setup effort.
Building beyond basic thresholds
Once basic deviation tracking works consistently, natural extensions emerge. You don't need to implement these immediately, but knowing the pathway helps design your initial system.
Weather-adjusted baselines account for seasonal variation. Instead of comparing to a flat three-year average, you compare to similar weather years. Drought years get compared to previous drought yields, not bumper crop seasons. This reduces false alarms while maintaining sensitivity to real problems.
Growth-stage-specific thresholds recognize that 10% deviation means different things at V4 versus R2. Early deviations might trigger nutrient interventions. Late deviations might just adjust harvest scheduling. Response matches opportunity.
Zone-based tracking within fields provides more granular insights without full precision agriculture complexity. Divide fields into 2-4 management zones based on soil type or topography. Track each zone separately. This catches problems that field averages might mask.
AI-enhanced operational software automates routine work. When scouts input observations through mobile apps, calculations happen automatically. Reports generate themselves. Alerts go directly to phones. Human judgment remains, but administrative burden disappears.
Multi-factor anomaly detection combines different indicators. Maybe a field shows only 8% yield deviation but also has unusual pest reports and irrigation issues. The combination triggers alerting even though individual factors don't. This catches complex problems simple thresholds miss.
Historical pattern matching identifies recurring issues. Field 7 shows problems every third year? The system flags it for preventive scouting in year three. This transitions from reactive to proactive management without complex predictive models.
Why systematic tracking works when everything else fails
Field yield anomaly detection doesn't require satellites, AI models, or data scientists. It requires consistent observation, simple baselines, and systematic prioritization. Farms implementing even basic tracking systems catch problems weeks earlier than those relying on visual symptoms alone.
Resistance to systematic tracking usually comes from perceived complexity. Farm managers envision expensive software, complicated statistics, another system to manage during overwhelming seasons. But a spreadsheet, consistent ratings, and weekly priority lists can transform scouting effectiveness.
Start with highest-value fields. Calculate three-year baselines. Set simple deviation thresholds. Generate one-page weekly reports. Build from there based on what provides value, not what technology vendors push.
Operations successfully using anomaly detection aren't necessarily the most technologically advanced. They're the ones that recognized the gap between "driving by and looking" and "comprehensive precision agriculture" — and filled it with practical, sustainable systems matching their operational reality.
The cost of missing field problems continues rising as margins tighten and input costs increase. Simple anomaly detection isn't just about catching problems anymore; it's about survival in competitive agricultural markets where 10% yield differences determine profitability.
This isn't about replacing human judgment with algorithms. It's about augmenting experienced operators with systematic tracking that catches what human memory and attention inevitably miss. The combination of human insight and consistent monitoring creates resilience that neither approach achieves alone.
Ready to revolutionize your farm management?
Join 500+ farms using Feldsly to boost yields, reduce waste, and streamline daily farm workflows.