
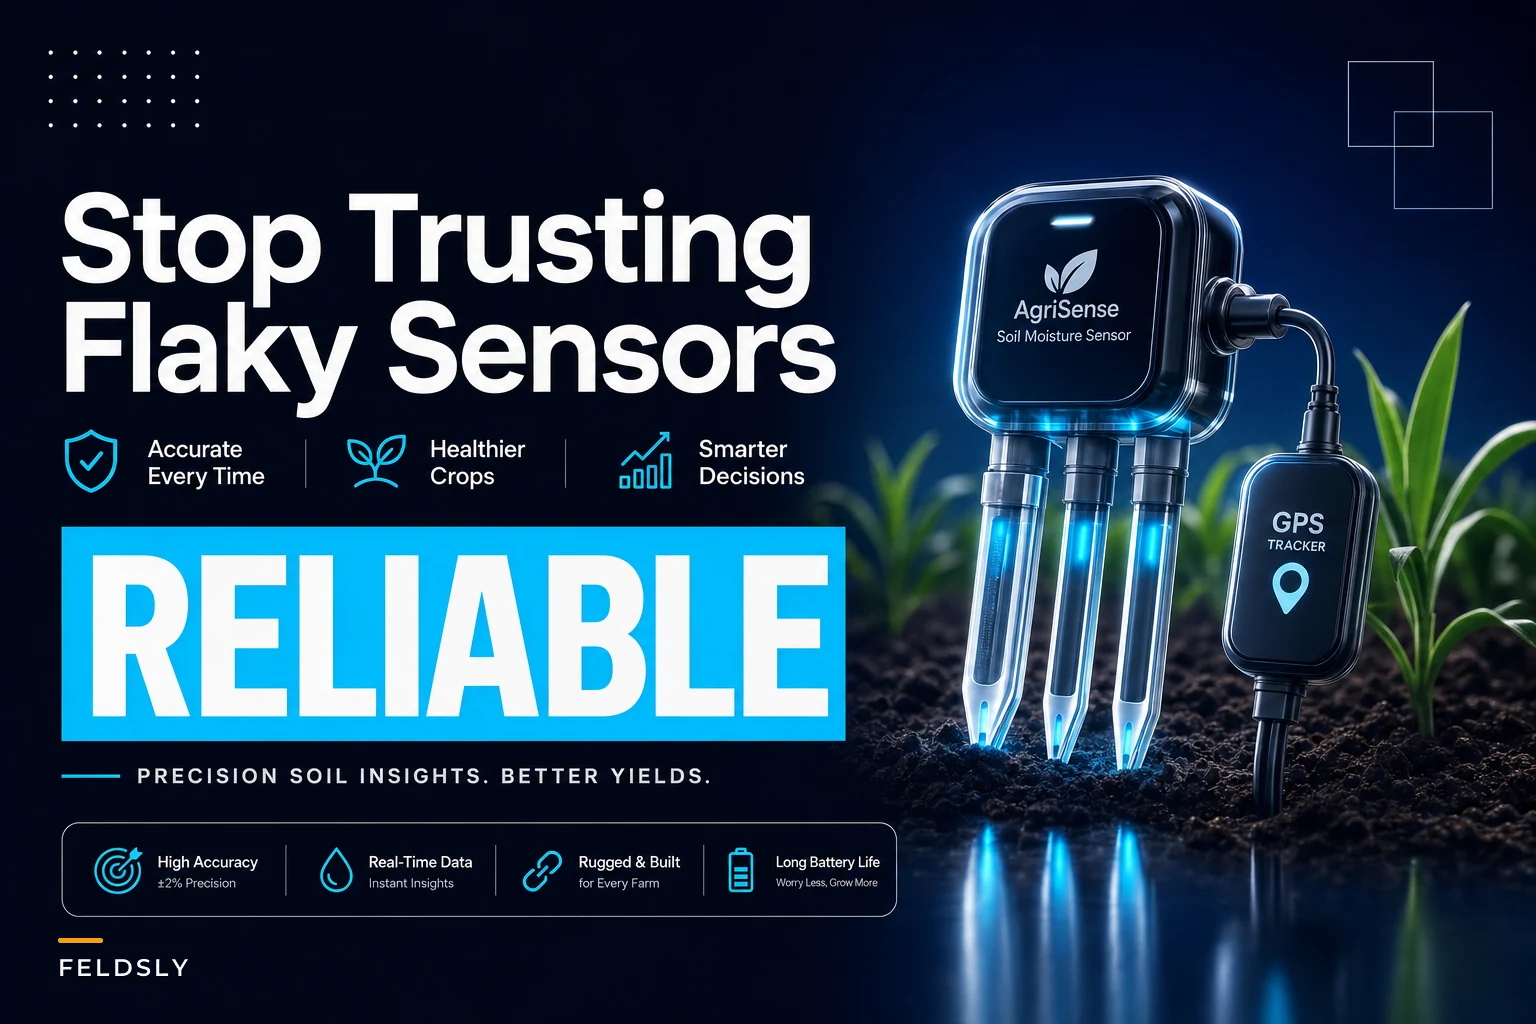

A soil moisture sensor reading of 22% VWC either means you skip today's irrigation set or you don't. Real decision, real dollars. And the ugly truth is that most farm sensor networks quietly drift into a state where nobody believes the numbers anymore — so people go back to walking fields with a shovel while $30k in probes sits there logging garbage.
This isn't a post about which brand of probe to buy. It's about the operational scaffolding around the sensors — where you put them, how you verify them, what you do when connectivity dies mid‑season, and how your crew keeps the whole thing honest. The hardware is rarely why a soil moisture sensor network fails on a farm. The failure is almost always operational.
The trust problem nobody talks about
Here's the pattern: a farm installs 12–18 sensor stations in year one, everyone's excited, the dashboard looks great through spring. Then by mid‑July, half the readings look "off," two stations went dark after a storm, one probe is reading swamp‑level saturation in a field that's visibly cracking, and the irrigation manager has quietly stopped opening the app.
The network didn't break. Trust broke.
And once trust breaks, it doesn't come back on its own. People revert to gut feel, the sensors become expensive weather stations, and next budget cycle someone asks why you spent the money. The whole thing gets written off as "that tech that didn't work for us," when the real issue was that nobody built a process to keep the data trustworthy.
The insight most people miss: a sensor network isn't a product you install. It's a system you operate. Same as your irrigation itself. You wouldn't run pivots for a season without checking pressure and nozzles — but people expect sensors to run untouched for years, which is exactly why they stop trusting them.
Start with a deployment map, not a sensor count
The first mistake happens before a single probe goes in the ground. Someone decides "we'll do 15 sensors" based on budget, then spreads them roughly evenly across fields. Even spacing feels fair. It's also close to useless.
Take control of your farm’s productivity.
Feldsly helps you plan, track, and optimize every farming operation with precision.
- Centralized crop scheduling
- Resource & labor management
- Real-time weather alerts
No credit card required
Document the decision each sensor informs at install time so future maintenance ties directly to action.
Sensors placed for coverage tell you the average. Sensors placed for decisions tell you what to do. Those are different goals.
What you actually want is a deployment map built around management zones — the spots where irrigation decisions genuinely differ. In real operations, that usually means placing stations at:
-
The driest representative zone in each irrigation block (sandy knolls, high spots, sandy‑loam transitions)
-
The wettest problem area (low spots, heavy clay, tail‑water accumulation)
-
One "typical" mid‑zone that represents the bulk of the block
-
Any spot with a history of yield variability — if scouting keeps flagging the same underperformers, that's a sensor location. Our notes on prioritizing scouting with yield benchmarks and anomaly alerts pair directly with this.
A practical rule: if two sensors would trigger the same irrigation decision every single time, you only needed one of them. Redundancy for reliability is good; redundancy for identical readings is wasted budget.
Document the map. Not in someone's head — an actual map with GPS coordinates, soil type at each station, install depth for each probe (say 6", 12", 24"), the block it governs, and the decision it informs. This document is the backbone of everything else. When a reading looks weird in August, the map is what tells you whether "weird" is even plausible for that soil at that depth.
A quick reference for what each depth is telling you
| Probe depth | What it's really for | Common misread |
|---|---|---|
| 6" (shallow) | Germination, early root zone, surface drying | Overreacts to a light rain; noisy |
| 12" (mid) | Primary decision zone for most row crops | Treated as "the" number when it's only part of the picture |
| 24"+ (deep) | Full profile refill, deep percolation, end‑of‑season reserve | Ignored because it changes slowly and looks "boring" |
The mistake is reading the shallow probe like it's the whole story. A 6" probe spikes after every drizzle, and if that's what your crew is watching, you'll get talked into irrigation sets you didn't need.
Here's a simple workflow for building and documenting a deployment map.
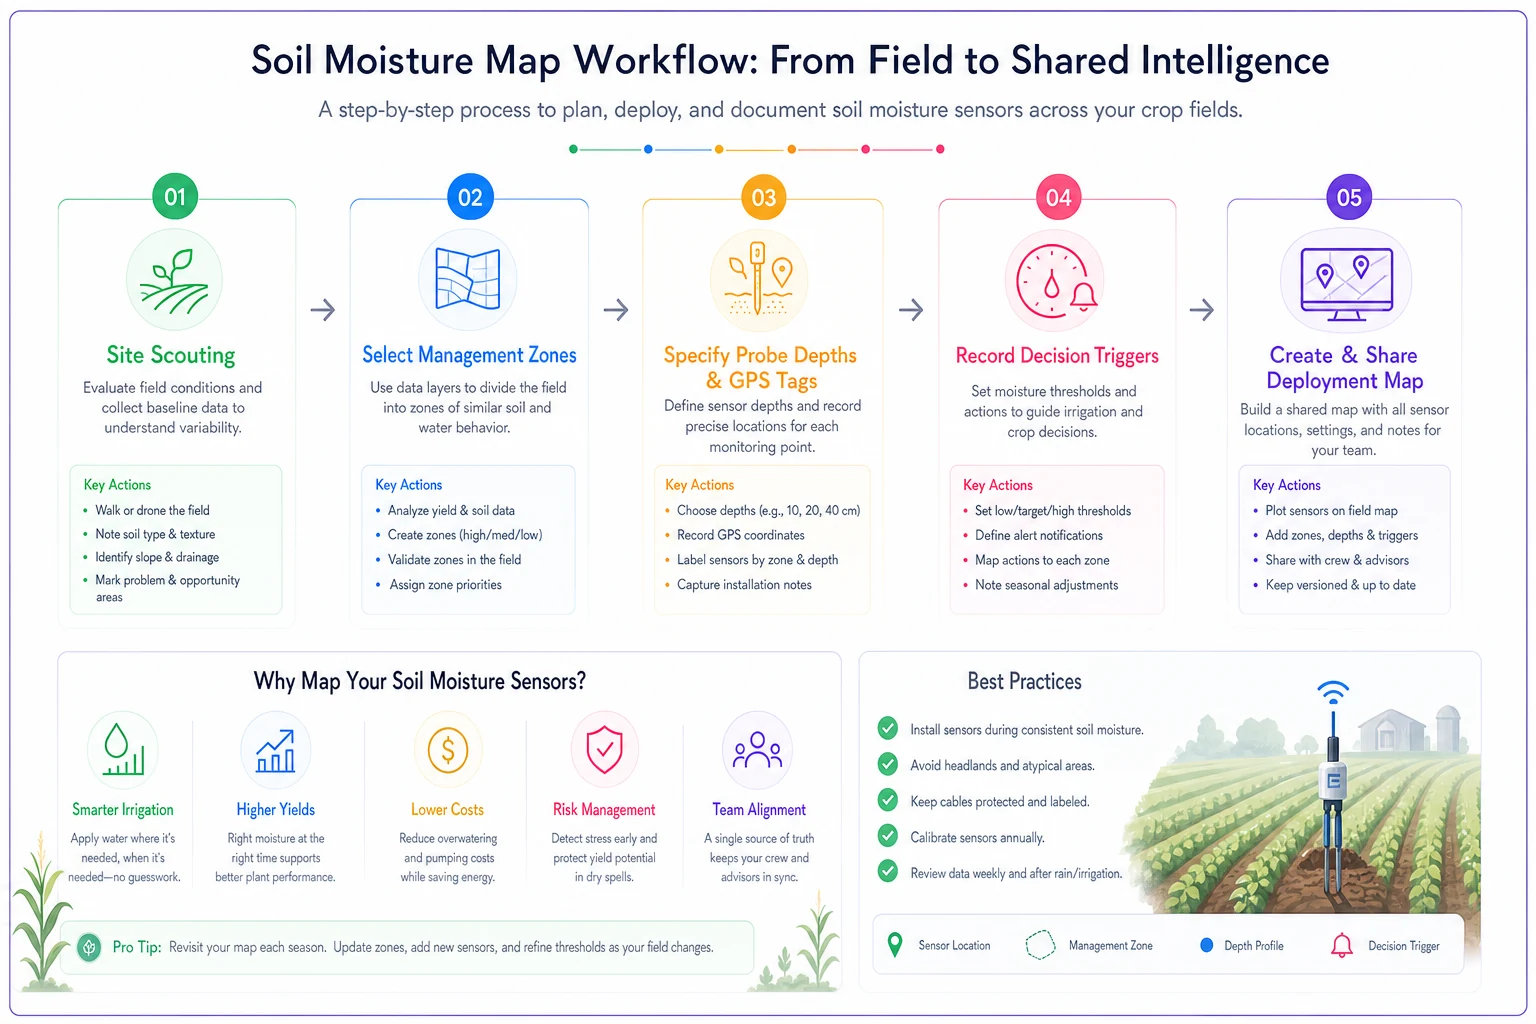
Use the map as the single source of truth when a reading looks unexpected.
Seasonal QA cadence: the part everyone skips
A sensor doesn't fail loudly. It drifts. A probe that read accurately in April can be reading 4–6 points off by August — soil settling around the housing, root intrusion, a cable a rodent chewed halfway through, a calibration that never matched your actual soil to begin with.
Drift is worse than an outright failure. A dead sensor is obvious. A drifting sensor is convincing. It gives you a plausible‑looking number that's wrong, and that's how you end up over‑ or under‑watering with total confidence.
-
Pre‑season full verification (before first irrigation). Every station gets a physical check and a calibration reference against a gravimetric sample or a hand probe reading in the same zone. This is your baseline. Nothing else matters if the baseline is wrong.
-
Post‑install settling check (2–3 weeks after any probe goes in fresh soil). New installs read poorly until soil re‑consolidates around the probe. Verify after the ground settles, not the day you install.
-
Monthly spot‑checks during peak irrigation. You don't check all of them — you rotate. Pick 3–4 stations a month, compare against a manual reading, log the delta.
-
Post‑event checks after big weather. After a heavy storm, hail, or high wind, walk the priority stations. This is where storm‑knocked antennas and flooded enclosures show up. If you're already running a weather‑risk process — and you should be, we covered one in this operational weather‑risk framework — fold the sensor post‑event check straight into it.
-
End‑of‑season teardown notes. Which stations gave trouble, which cables need replacing, what you'll move next year.
The point of the cadence isn't to check everything constantly. It's to check the right things at the right moments so drift gets caught before it costs you an irrigation decision.
What a quick calibration check actually looks like
-
Pull a hand‑probe or gravimetric reading in the same zone, same depth, within a few feet of the station
-
Compare against what the sensor reported at that timestamp
-
Log the difference (the delta), not just "looks fine"
-
Flag anything beyond your tolerance band — for most row‑crop decisions, a consistent 3+ point VWC gap is worth investigating
-
If a station is off, note whether it reads consistently high or low — a stable offset is easy to correct; erratic swings usually mean a hardware or connection problem
The key habit is logging the delta over time. One reading tells you nothing. A drift log — same station, checked monthly, delta trending from +1 to +2 to +5 — tells you exactly when and how fast a probe is going bad. That trend line is worth more than any single "accurate" reading.
Low‑tech redundancy: assume the network will fail
Every sensor network on a farm will have gaps. Cell coverage drops in a bottom field. A gateway loses power. A vendor's cloud goes down on the one 100°F day you needed the data most. If your irrigation decision has no fallback when the digital number is missing, you don't have a decision system — you have a single point of failure with a nice dashboard.
The fix isn't more technology. It's deliberate low‑tech redundancy layered underneath the sensors:
-
Manual probe stations. Mark 2–3 permanent hand‑probe checkpoints per block with a flag or post. Anyone can pull a reading in seconds, and it doubles as your calibration reference.
-
Feel‑and‑appearance benchmarks. Old‑school, still works. A laminated card in the truck showing what soil at each moisture level looks and feels like for your specific soil types. Sounds primitive; saves you when the network's down.
-
A visible install of a simple tensiometer or two in your most decision‑critical zone as a mechanical cross‑check that needs no battery and no signal.
-
A written "if the data's dark" rule. Literally
"If Block 4 sensors are offline more than 24 hours during peak, default to a hand‑probe reading before running a set." Decide this in advance, not in a panic at 5 a.m.
The pattern to avoid: crews who become so dependent on the app that when it goes dark, all irrigation decisions freeze until someone "fixes the tech." Meanwhile the crop's stressing. Low‑tech redundancy keeps decisions moving when the network doesn't.
The crew maintenance checklist that keeps it all honest
None of this survives if it lives in one person's head. The single biggest reason sensor networks decay is that maintenance is nobody's explicit job. It's "we'll get to it," and then it's August and three stations are dead.
Assign it. Make it routine. Here's the crew‑level maintenance checklist that keeps a network trustworthy through a season:
Weekly (during active irrigation):
-
Glance at the dashboard for any station reporting flatlined or clearly impossible values
-
Confirm every station reported in the last 24 hours; flag any that went silent
-
Check battery/signal status indicators for anything trending low
Monthly:
-
Rotate through 3–4 stations for a physical + calibration spot‑check (log the delta)
-
Inspect enclosures for water intrusion, insect nests, corrosion on terminals
-
Check cable runs for rodent damage and UV cracking, especially near ground level
-
Clear vegetation growing up around solar panels or antennas
-
Confirm probe housings haven't heaved or settled out of position
After every significant weather event:
-
Walk priority stations for physical damage
-
Reseat any knocked antennas or panels
-
Verify data resumed after the event
End of season:
-
Pull, clean, and store any probes coming out of the ground
-
Document every station's trouble history for next year's deployment map
-
List replacement parts to order in the off‑season, not mid‑crisis
The person who owns this doesn't need to be technical. They need to be consistent. A reliable crew member with a printed checklist beats a brilliant agronomist who "means to get around to it."
A real scenario: what tightening this up actually does
Consider a mid‑size irrigated operation — around 1,400 acres of row crop across a mix of pivots and drip, with roughly 16 sensor stations installed two seasons prior. By their second summer, the irrigation manager admitted he was ignoring the network on maybe a third of his decisions because too many readings had burned him. Two stations had been dead since a June storm and nobody had pulled them. The system was technically "installed" and functionally half‑abandoned.
They didn't buy new hardware. They built the operational layer: a documented deployment map, a monthly rotating calibration check with a logged delta, two permanent hand‑probe checkpoints per block, and a one‑page crew checklist assigned to a specific person.
The change that next season wasn't dramatic on any single day — it was cumulative. Drift got caught early on three stations before it skewed a decision. A gateway outage that would've frozen irrigation for a bottom field got handled with the fallback hand‑probe rule, no drama. By season's end the manager had trimmed a handful of unnecessary irrigation sets on the over‑watered end and caught a couple of genuinely stressed zones earlier than he would have by feel. Not a headline number — just the network finally doing the job it was bought to do. The bigger win was intangible: people started trusting the readings again, which meant the whole investment stopped being dead weight.
When this level of rigor makes sense — and when it doesn't
When it's worth it: You're irrigating with real cost pressure (pumping energy, water allocation limits, deficit‑irrigation strategy), you farm variable soils where zone‑level decisions matter, or you've already got sensors installed and quietly distrusted. If you've spent the money on hardware, the QA layer is what makes that money mean something.
When it's overkill: A handful of stations on uniform soil under abundant, cheap water, where you're irrigating on a fixed schedule anyway. If moisture data isn't changing what you do, an elaborate QA cadence is process for its own sake. Match the rigor to the size of the decision.
Who should not start here: If you haven't yet defined what decision each sensor is supposed to inform, don't build a maintenance program yet. Sort the deployment map and the decision logic first. Maintaining sensors that aren't tied to a decision is just tidy busywork.
Where software helps — and where it doesn't
Worth being honest about this: no platform fixes a network you don't maintain. What good operational software does is remove the friction that makes people skip the maintenance. A shared dashboard that flags silent stations automatically, keeps your calibration deltas in one drift log instead of scattered notebooks, assigns the maintenance checklist to a specific person with reminders, and holds the deployment map where the whole crew can see it — that's the difference between a QA cadence that lives on paper and one that actually happens.
The software isn't the point. The trustworthy readings are. Tools just make the discipline easier to sustain across a busy season when everyone's stretched thin. Even a simple shared spreadsheet plus a recurring reminder beats good intentions.
The takeaway
A soil moisture sensor network on a farm earns its cost through the irrigation decisions it changes — and it only changes decisions people believe. Trust is built by the boring operational layer around the hardware: a deployment map tied to real management zones, a seasonal QA cadence that catches drift before it lies to you, low‑tech redundancy for when the network inevitably goes dark, and a crew checklist that makes maintenance somebody's actual job.
Do that, and you stop guessing whether 22% VWC means run the set or skip it. You know. That's the whole reason you bought the sensors in the first place.
Ready to revolutionize your farm management?
Join 500+ farms using Feldsly to boost yields, reduce waste, and streamline daily farm workflows.