
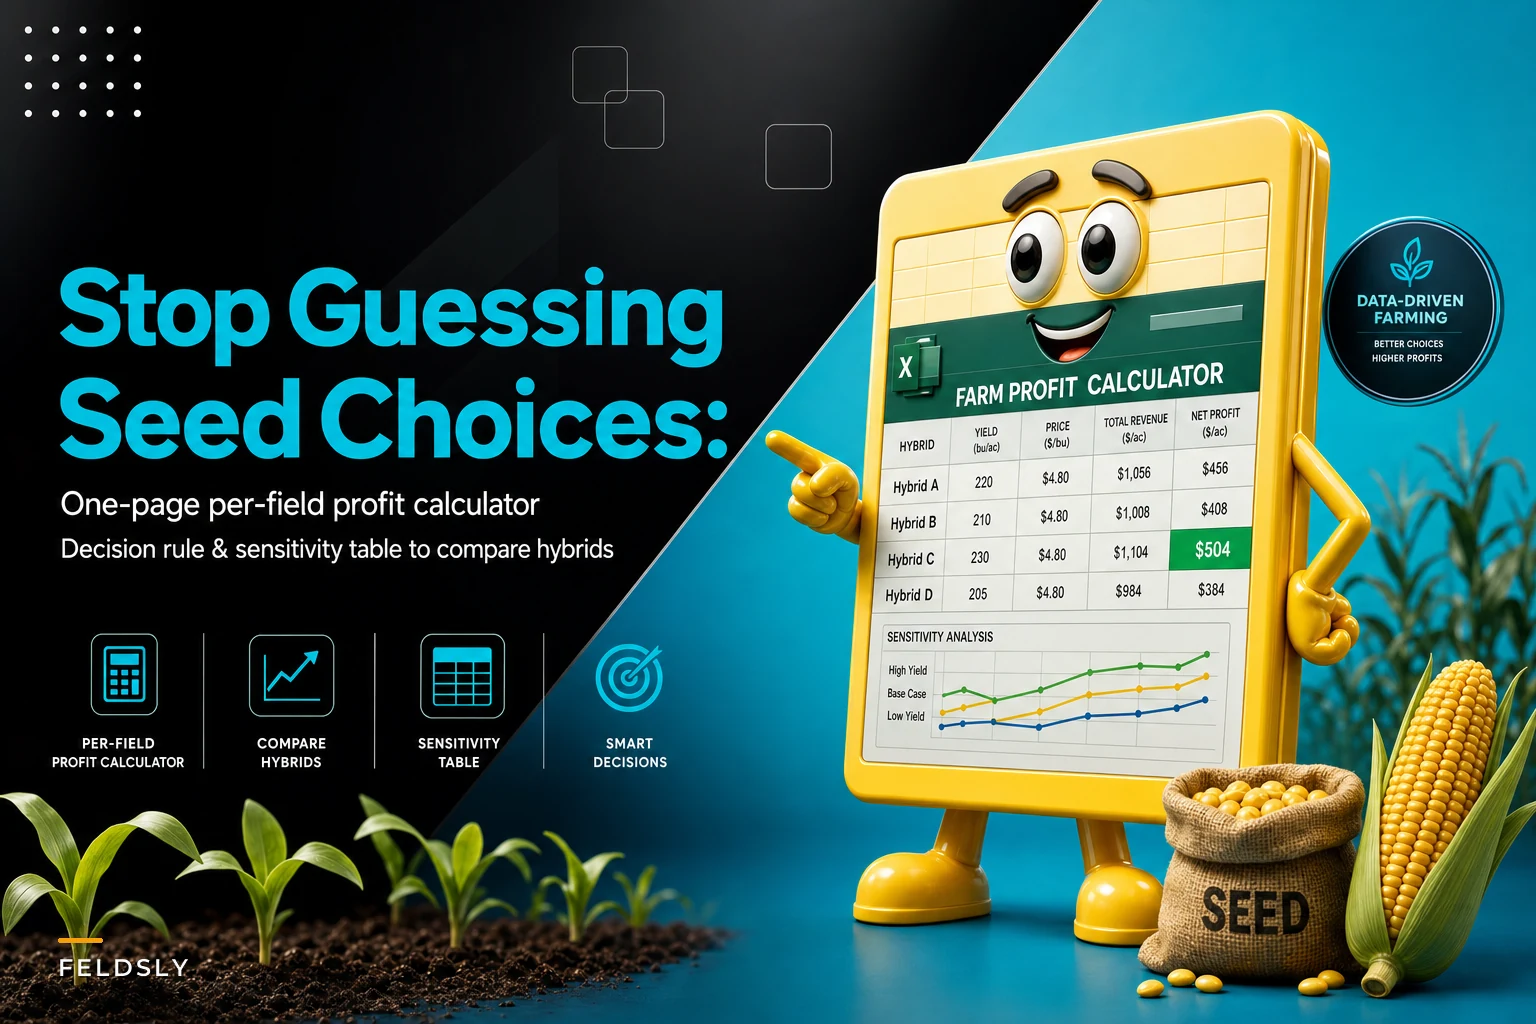

Most seed decisions get made in a truck cab in February, half from memory and half from whatever the seed rep left on the counter. Somebody remembers that the 108‑day corn "did great on the river ground last year," so it gets ordered again. Nobody actually wrote down what it netted after seed cost, the drying penalty, and the fact that half that field got replanted.
That's the gap this article fixes. Not a big farm‑management overhaul — just a single sheet per field that turns your own history and real input costs into an expected profit per acre, with a decision rule you can defend when someone questions the pick. The goal is a field profitability calculator farm operators can fill out in fifteen minutes and actually trust.
Why the "last year's winner" habit quietly loses money
The trap isn't that farmers ignore numbers. It's that the numbers they remember are the wrong ones. Yield sticks. Cost, moisture penalties, and buyer premiums don't.
A hybrid that yielded 15 bushels more can still net less per acre once you factor in seed that was $40/bag higher and grain that came out three points wetter. This usually happens when the higher‑yield hybrid is a longer‑maturity number that leans on late‑season conditions you can't count on every year. The good year sticks in memory; the two mediocre ones don't.
There's also a subtler pattern. When a field has a range of soil types, people evaluate the whole field on its best zone. The river bottom carries the average, the hilltop drags it down, and the seed choice keeps getting made for ground that's only a third of the acres. A per‑field sheet forces you to name the field's actual expected yield — not its best memory.
What the one‑page sheet actually contains
Keep it to a single page per field. If it spills onto a second page you've turned a decision tool into a research project, and it won't get used at planting.
Take control of your farm’s productivity.
Feldsly helps you plan, track, and optimize every farming operation with precision.
- Centralized crop scheduling
- Resource & labor management
- Real-time weather alerts
No credit card required
-
Field identity and constraints — acres, dominant soil, drainage, rotation slot, and any hard limits (herbicide carryover, a landlord who wants a specific crop, a wet corner that always plants late).
-
Historical yield — three to five years for this field, not the farm average. Note the weather type of each year (dry, normal, wet) so you can read the spread honestly.
-
Candidate hybrids/crops — two to four options you'd realistically plant here.
-
Cost and revenue inputs — seed cost per acre, expected price, buyer premiums or discounts, drying and hauling.
-
The output — expected profit per acre for each candidate, plus a sensitivity row.
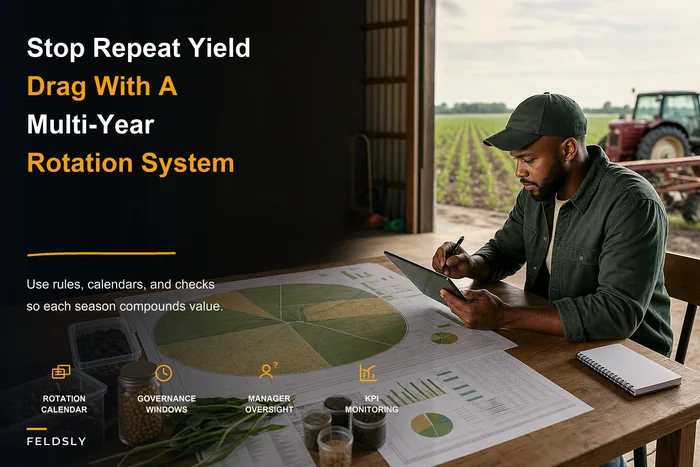
The constraints block matters more than people expect. A hybrid can win on paper and still be wrong because it doesn't fit the rotation you're protecting. If you're managing rotation deliberately — and you should be, per the logic in this multi‑year crop rotation system — the calculator has to respect those slots, not work around them.
Here's a simple workflow to fill the sheet:
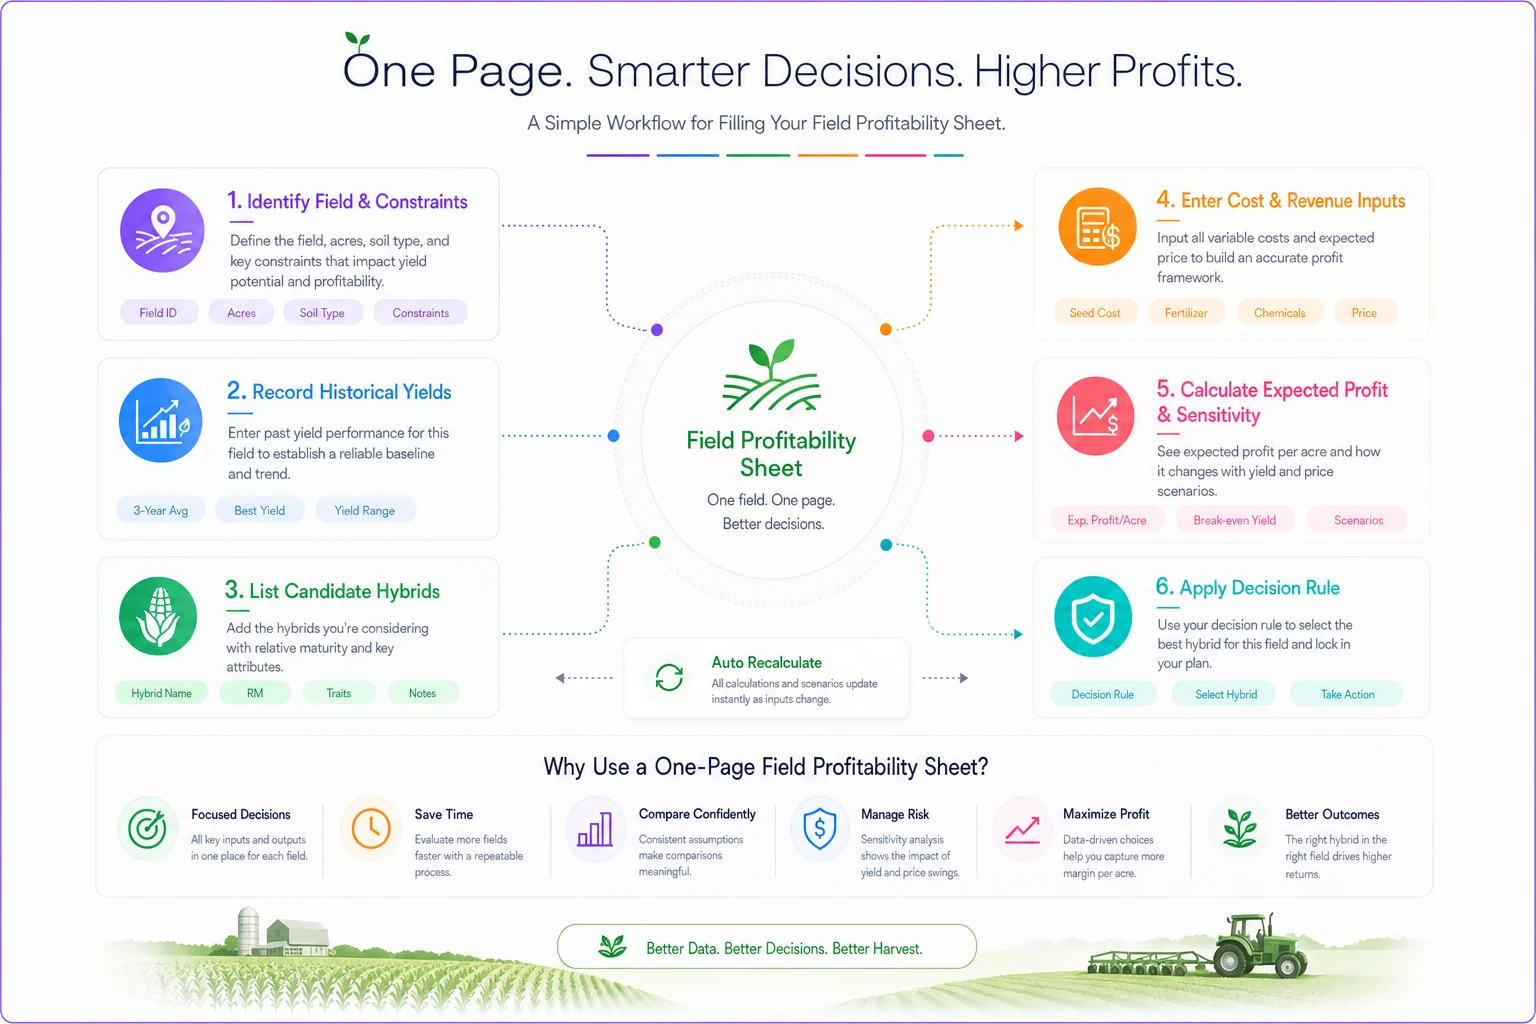
Use the same order every time so the sheet stays quick and consistent across fields.
The math, plainly
For each candidate on a given field:
Expected revenue/acre = expected yield × (base price + premium − discount
Expected cost/acre = seed + the input costs that differ between candidates
That second part trips people up. You don't need to load every cost into the sheet — fuel, most passes, and land cost are usually the same no matter which hybrid you pick. Only the costs that change with the choice affect the comparison. That's typically seed price, any trait‑driven chemical difference, and moisture‑related drying.
Expected profit/acre = expected revenue − differing cost
Then subtract the drying penalty separately if maturities differ, because that's where longer‑season hybrids quietly bleed margin.
| Item | Hybrid A (105‑day) | Hybrid B (111‑day) |
|---|---|---|
| Expected yield (bu/ac) | 198 | 209 |
| Cash price ($/bu) | 4.35 | 4.35 |
| Premium/discount | 0 | 0 |
| Gross revenue/ac | $861 | $909 |
| Seed cost/ac | $118 | $132 |
| Differing chem/ac | $0 | $8 |
| Expected harvest moisture | 16% | 19% |
| Drying cost/ac (est.) | ~$14 | ~$41 |
| Expected profit/ac | ~$729 | ~$728 |
On raw yield, B looks like the obvious pick — 11 bushels is nothing to sneeze at. Once seed, a small chemistry difference, and the wetter harvest go in, they're a dead heat. And that's before you factor in the risk that B needs a good late season to actually hit 209. The sheet doesn't tell you the "right" answer here; it tells you that the yield gap you were about to pay for isn't paying you back.
The sensitivity row that keeps you honest
A single expected‑profit number pretends you know the future. You don't. So every candidate gets one sensitivity row: what happens to profit per acre if yield comes in 10% under expectation and price drops by a realistic amount — say 30–40 cents.
This is where longer‑maturity, higher‑yield picks usually get exposed. They tend to have wider yield swings across weather types, so their downside is deeper. When you drop both candidates above by 10% yield and 35 cents:
-
Hybrid A downside
profit falls to roughly $580–$600/ac
-
Hybrid B downside
profit falls to roughly $555–$580/ac
B doesn't just lose its tie — it loses harder on the downside. For a field you already know is inconsistent, that asymmetry should tip the decision toward the steadier hybrid even when expected values are equal.
You don't need Monte Carlo simulations for this. Two stress numbers per candidate is enough to turn bad decisions into defensible ones.
The decision rule
The sheet is useless without a rule you commit to before you run the numbers — otherwise you'll just rationalize your favorite pick after the fact. Most operators who get this wrong aren't careless people; they're just setting the rule after they already know the outcome.
-
Pick the highest expected profit/acre — unless a competing candidate is within about $15/acre AND has a clearly better downside in the sensitivity row. Then pick the steadier one.
-
Never pick a candidate that violates a hard constraint, no matter how good the profit looks. Rotation slot, carryover, and landlord terms are non‑negotiable inputs, not tiebreakers.
-
If two candidates are within ~$10/acre on both expected and downside, break the tie on operational fit — maturity spread for harvest logistics, seed availability, standability on that specific field.
The $15 band matters. Without it, people chase two‑dollar‑per‑acre "wins" that are pure noise and take on more risk to get them.
A quick checklist before you trust any sheet
Run through this checklist before you act on a sheet to make sure it reflects the field and the decision rule.
-
- [ ] Yields are for this field, not the farm average
-
- [ ] History spans at least three years and notes weather type
-
- [ ] Only differing costs are included, not every cost
-
- [ ] Drying penalty is calculated separately when maturities differ
-
- [ ] Premiums and discounts reflect your actual buyer, not the elevator's board price
-
- [ ] Every candidate has a sensitivity row
-
- [ ] Hard constraints are written down and checked
-
- [ ] The decision rule was set before the numbers were run
That last box catches the most expensive mistake — moving the goalposts to justify the hybrid you already liked.
A real scenario
A family corn‑and‑soybean operation running around 2,400 acres across a dozen fields had been ordering seed largely by momentum. Their two "flagship" hybrids were long‑maturity, high‑yield numbers planted almost everywhere, including on several inconsistent fields with hilltops that never carried their weight.
Building one sheet per field surfaced the problem fairly quickly. On roughly four of their weaker fields — somewhere around 500 acres — the flagship hybrid's expected profit landed within a few dollars of a shorter‑maturity option, and its downside was clearly worse. They switched those acres to the steadier hybrid and left the flagships on the strong ground where the yield potential actually paid off.
The following fall wasn't a blowout year, which was exactly the point. On the switched acres they saved meaningfully on drying because harvest moisture ran several points lower, and the shorter hybrids held closer to expectation while the long numbers underperformed on the poorer ground again. The operator's rough estimate was somewhere in the $18–$25/acre range across those fields — not a headline number, but real money on 500 acres, and it repeated the next year because the decision was structural, not lucky.
When this is worth doing — and when it isn't
It makes sense when you farm multiple fields with meaningfully different soils, when you're comparing hybrids with different maturities or trait packages, or when buyer premiums (food‑grade, non‑GMO, specific protein specs) change the revenue picture field to field.
It's overkill when you farm a handful of uniform fields with one crop and one buyer. If every field is the same dirt with the same agronomy, a single spreadsheet for the whole operation does the job — per‑field sheets just add work.
Who should skip the sensitivity step entirely: nobody, honestly. It's the cheapest part and it's where the sheet earns its keep. If you're going to cut a corner, cut the number of candidates you compare, not the downside check.
Where this connects to the rest of your planning
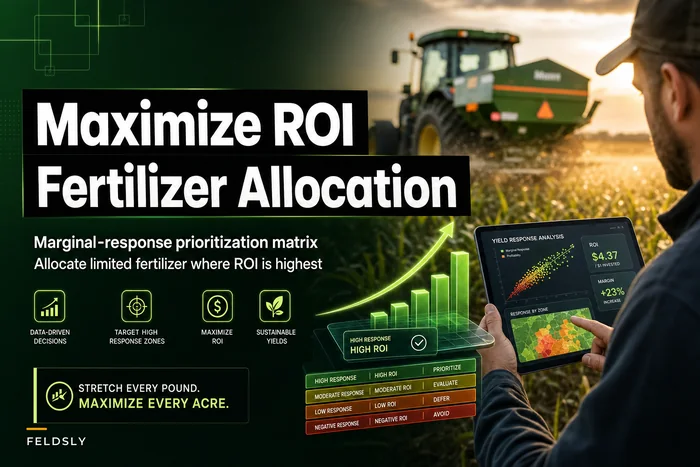
The calculator doesn't live alone. The cost inputs are only as good as your input plan, and if fertilizer allocation is being decided separately, the two decisions should talk to each other. A hybrid's expected yield assumes a fertility level — if that field isn't getting the inputs that yield assumes, your expected‑profit number is fiction. That's the whole point of running a marginal‑response prioritization matrix on limited fertilizer alongside seed selection rather than treating them as separate conversations.
Same goes for rotation. The seed sheet respects the rotation slot; the rotation plan sets which slots exist. Keep those in the same conversation and the calculator stops being a February guessing exercise and starts being something you can actually defend to a landlord, a lender, or your own future self staring at a disappointing harvest.
Run the marginal‑response prioritization matrix on limited fertilizer alongside the seed sheet so yield assumptions and input plans match.
Some operations are also starting to manage these sheets inside operational platforms that track field history, carry input costs forward year to year, and flag when a chosen hybrid conflicts with a rotation rule or input budget. It doesn't replace the thinking — but it means the sheet actually gets updated instead of sitting in a folder from two seasons ago. For farms running a lot of fields, that kind of centralized tracking is worth looking into.
Bottom line
Seed decisions don't fail because farmers are careless. They fail because yield is memorable and everything else that determines profit — cost, moisture, premiums, downside risk — isn't. A one‑page per‑field sheet fixes that by putting the forgettable numbers next to the memorable ones and forcing a decision rule you set before the emotion kicks in.
Start with your two or three most inconsistent fields, the ones where you've never been quite sure the "winner" was really winning. Build a sheet for each, run two candidates, add the sensitivity row, and apply the rule. You'll usually find at least one field where the obvious choice quietly wasn't — and that's the field that pays for the whole exercise.
Ready to revolutionize your farm management?
Join 500+ farms using Feldsly to boost yields, reduce waste, and streamline daily farm workflows.