
Last harvest, a corn farm outside Decatur lost $47,000 in three days when their combine header drive went down. Not because they couldn't get parts—they had the bearings sitting in storage. The crew just didn't know the warning signs were already showing up two weeks earlier during a routine greasing.
This happens constantly across crop operations. Equipment breaks during the worst possible windows, not because maintenance gets ignored completely, but because farms run maintenance schedules that don't account for how machinery actually degrades under seasonal stress.
Why traditional maintenance schedules fail during critical windows
Most farms inherit their maintenance approach from equipment dealers or previous managers. Change the oil at X hours. Grease bearings every Y acres. Replace belts before spring. These intervals work fine in average conditions, but farming doesn't happen in average conditions.
A tractor pulling a ripper through wet clay generates completely different wear patterns than the same tractor running a sprayer over dry ground. Yet maintenance schedules rarely adjust for actual operating conditions. Mean time between failures shifts dramatically based on soil conditions, moisture levels, operating speeds, and load factors—but maintenance intervals stay fixed.
What really destroys this approach is how failures cluster around critical operational windows. Equipment doesn't randomly break in January when you have time to fix it. Breakdowns concentrate during planting when every hour matters, or during harvest when moisture windows are tight. The operational cost of downtime during these periods can be 10-20x higher than off-season repairs, yet maintenance planning rarely accounts for this.
Standard maintenance also misses the compound effect of deferred issues. A slightly worn bearing might last another 200 hours under normal conditions. Run that same bearing through a wet harvest where the combine is constantly loaded beyond rated capacity, and it'll fail in 20 hours. Maintenance schedules don't capture those conditional failure rates.
Building mean-time-between-failure models without complex telemetry
You don't need $50,000 in sensors to predict when machinery will fail. Most failure patterns follow predictable degradation curves based on observable conditions and simple operational metrics.
Take control of your farm’s productivity.
Feldsly helps you plan, track, and optimize every farming operation with precision.
- Centralized crop scheduling
- Resource & labor management
- Real-time weather alerts
No credit card required
Start with historical failure data from your own equipment. When did the combine feeder chain last break? What were the operating conditions leading up to it? How many separator hours? What was the crop moisture? How much foreign material was going through?
For each critical component, build a simple failure model using these four inputs:
-
Base interval (manufacturer recommendation)
-
Condition multipliers (wet/dry, heavy/light crop, clean/weedy fields)
-
Load factors (acres per day, operating speed, material throughput)
-
Environmental stress (temperature swings, dust levels, moisture exposure)
A combine header drive might have a base interval of 800 separator hours. But if you're harvesting high-moisture corn (0.8x multiplier), in weedy conditions (0.9x), pushing 20% above normal ground speed (0.85x), your adjusted interval becomes 800 × 0.8 × 0.9 × 0.85 = 490 hours.
Track those predicted intervals against actual failures. After two seasons, you'll have calibrated models that predict component failures within roughly 10-15% accuracy—without installing a single sensor. The key is consistently recording operating conditions when failures occur, then using that data to refine your multipliers.
Some farms overcomplicate this. You don't need statistical software or complex algorithms. A spreadsheet with columns for component, base interval, conditions, and actual failure hours gives you everything needed to spot patterns and adjust predictions.
Downtime cost modeling for seasonal operations
The real damage from equipment failure isn't the repair cost—it's the operational impact during critical windows. A $1,200 hydraulic pump replacement in February is an inconvenience. The same repair during planting might cost $15,000 in delayed planting yield penalties.
| Operational Window | Base Downtime Cost | Key Risk Factor | Example Scenario |
|---|---|---|---|
| Planting (Apr 15 – May 15) | $2,400/day | Weather penalty: +$800/day | 3-day planter breakdown = $7,200+ base |
| Spraying (June – July) | $600/day | Re-spray cost: $35/acre if window missed | 2-day failure post-emerge = $3,400 impact |
| Harvest (Sep 15 – Nov 1) | $3,100/day | Storm risk: +$4,200/day | 4-day combine breakdown = $12,400+ base |
These aren't abstract numbers. Track your actual losses from past breakdowns. What did that header failure really cost when you factor in field losses, quality discounts, and drying charges from harvesting too wet because you missed the optimal window?
Once you understand true downtime costs, maintenance decisions become clearer. Spending $3,000 on preventive component replacement before harvest makes obvious sense when a mid-harvest failure costs $15,000. The math changes completely when you model actual operational impact instead of just repair expenses.
Parts inventory rules that balance cost and availability
Every farm struggles with parts inventory. Stock too much and you tie up capital in components that might never fail. Stock too little and you're making 3 AM parts runs or waiting two days for overnight shipping during critical operations.
The answer isn't keeping every possible part on hand. It's understanding which failures you can absorb and which ones you can't, then stocking accordingly.
Critical/Long-Lead Stock 100% of requirements. These are parts that would shut down operations and take more than 24 hours to source. Header drive chains, specialized bearings, ECM modules. Yes, they're expensive to stock, but the downtime cost during critical windows justifies it.
Critical/Quick-Source Stock 50% or maintain verified local sources. These parts would stop operations but can be sourced same-day locally. Hydraulic hoses, common belts, filters. Keep enough for immediate repairs but don't overstock what's readily available.
Non-Critical/Long-Lead Order at 60% of predicted life. These won't stop operations immediately but take time to source. Cab glass, non-essential sensors, comfort components. Order early based on your failure predictions so parts arrive before they're needed.
Non-Critical/Quick-Source No inventory needed. These parts won't stop operations and are readily available. Light bulbs, common hardware, basic electrical components. Buy as needed.
For critical parts, calculate stocking levels based on your predicted failure interval, number of machines using the component, lead time for replacement, and downtime cost if unavailable. A combine operation running three machines with header drives failing every 800 hours should stock at least one complete rebuild kit if lead time exceeds 24 hours during harvest. The $2,000 inventory cost prevents a potential $15,000 downtime loss.
Track your parts usage patterns too. Which components actually fail? How often? A simple spreadsheet logging every part pulled from inventory reveals patterns fast—certain bearings fail every season, specific belts almost never do. Adjust stocking levels based on actual consumption, not theoretical failure rates.
Simple predictive signals crews can spot without sensors
Operators see warning signs weeks before failures occur. They just don't always recognize them or communicate them up the chain. Building a simple observation system catches degrading components before they fail during critical operations.
Hydraulic System Degradation Morning startup takes longer to build pressure. Functions slower when cold, normal when warm. Slight drift in position when holding loads. Small leaks appearing around fittings. These indicate pump wear or internal valve leakage—usually 50-100 hours before complete failure.
Drive Component Wear Rhythmic vibration at specific speeds. Occasional slipping under heavy loads. Unusual noise patterns during direction changes. Visible slack in chains or belts during operation. These patterns show up 2-3 weeks before catastrophic failure.
Bearing Deterioration Temperature differences you can feel by hand. Grease discoloration or metal particles. Slight play when checking with machinery stopped. Changes in sound pitch during operation. Catching these signs prevents seized bearings that cascade into major damage.
Create simple inspection sheets that operators fill out weekly during season. Not complex multi-page forms—a single page with 10-12 yes/no observations. "Any unusual noises? Any new leaks? Any sluggish hydraulics?" Takes five minutes but catches problems while they're still manageable.
Make the inspection sheet one page and store completed sheets with the machine's service record so trends are easy to spot.
Some farms try to get too sophisticated here. You don't need vibration analysis or oil sampling programs to start. Just consistent observation of changes from normal operation. An operator who runs the same combine every day will notice when something sounds off, even if they can't explain exactly what changed.
The harder challenge is building a culture where operators actually report these things without worrying they'll catch blame for the problem. Make it clear: reporting early warning signs prevents breakdowns. The operator who mentions "the header seems to shake more than usual" just saved you from a $15,000 harvest repair.
Creating maintenance windows that align with crop cycles
Standard maintenance schedules assume you can service equipment whenever hour meters hit certain thresholds. Farming doesn't work that way. You can't pull a planter offline for major service when fields are finally fit after a two-week rain delay. Maintenance has to fit into natural operational gaps.
January-February: Deep Maintenance Window Complete rebuilds and major overhauls. Transmission work, engine rebuilds. Frame repairs and structural work. Time-intensive diagnostics and adjustments. March: Pre-Plant Prep Planter calibration and component replacement. Tractor hydraulic service. Field cultivator bearing replacement. Critical system testing under load. May-June: Quick Service Gap Post-planting inspections. Sprayer pump rebuilds. Minor repairs found during planting. Oil changes and filter replacements. August: Pre-Harvest Prep Combine inspection and component replacement. Header drive servicing. Grain handling equipment preparation. Harvest tractor servicing. November-December: Post-Harvest Recovery Damage assessment and repair. Preliminary servicing before storage. Parts ordering for winter rebuilds. Equipment cleaning and preservation.
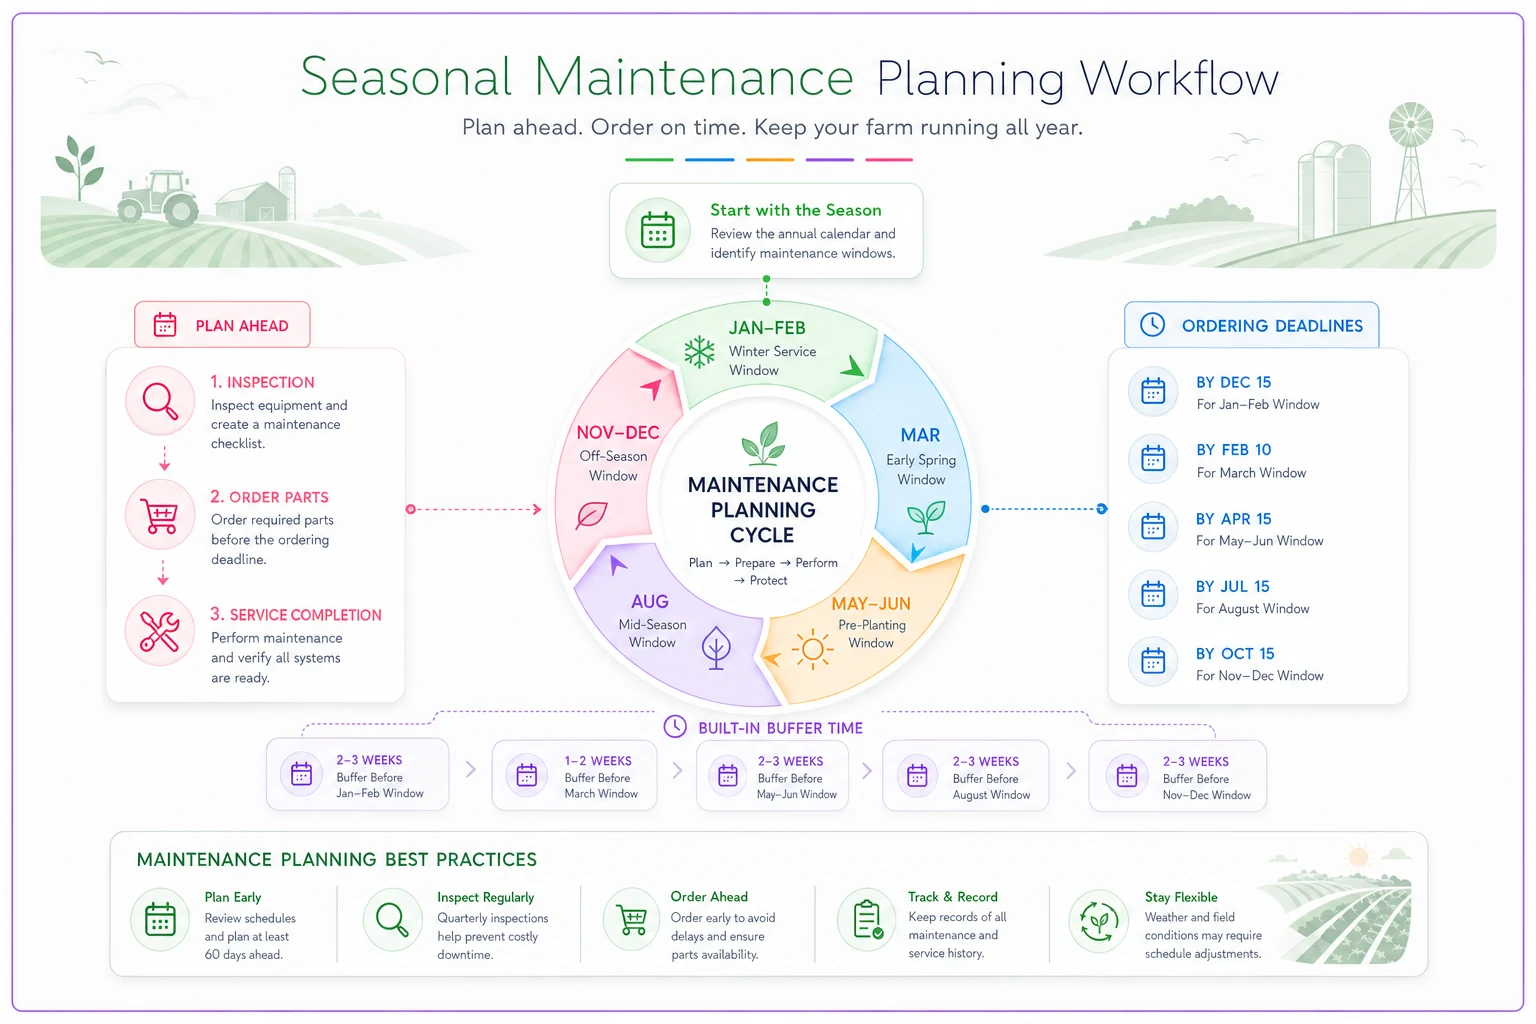
Plan backward from critical windows. If harvest starts September 15, all combine maintenance must be complete by September 1. That means parts need to be ordered by August 15, which means inspections happen by August 1. That cascade keeps maintenance happening when you have time, not when equipment is failing.
Build buffer time in too. If a repair should take two days, plan for four. Weather delays, parts problems, and unexpected damage almost always extend timelines. Better to finish early than to rush critical maintenance as the window closes.
Some maintenance can shift between windows based on usage. If your sprayer only ran 60% of expected hours, push major service to post-harvest instead of the June window. But never defer maintenance past a critical operational window—the downtime risk isn't worth it.
Lifecycle governance beyond basic hour tracking
Most farms track hours and that's it. But hours alone don't tell you when equipment will fail or how to optimize replacement cycles. Real lifecycle governance tracks multiple degradation factors and uses them to drive replacement and rebuild decisions.
| Tracking Category | What to Record |
|---|---|
| Operating hours | Separator, engine, PTO hours |
| Acres processed | By crop type and field conditions |
| Material throughput | Bushels, tons, gallons |
| Repair history | Costs and root causes |
| Downtime events | Duration and operational impact |
| Operating cost per unit | Fuel, repairs, labor per acre |
This builds a complete picture of equipment lifecycle economics. A combine might have 2,400 separator hours, but what really matters is it's processed 18,000 acres, had three major failures, costs $47 per acre to operate, and caused $31,000 in downtime losses over the past two seasons.
Set governance thresholds that trigger decisions:
-
When repair costs exceed 40% of replacement value in a year
-
When downtime costs exceed 25% of replacement value annually
-
When operating cost per acre increases 30% above baseline
-
When reliability drops below 95% during critical windows
These triggers tell you when keeping old equipment is actually costing more than replacing it—factoring in the full operational impact, not just repair bills. A $400,000 combine that causes $50,000 in annual downtime losses might need replacement even if it's mechanically sound.
The governance system also guides rebuild versus replace decisions. Minor rebuilds that restore 80% reliability for 30% of replacement cost make sense. Major rebuilds costing 70% of replacement value rarely do, especially on equipment with obsolete technology or poor parts availability.
Track this data in something more sophisticated than paper files. Even a basic spreadsheet consolidating hours, repairs, and downtime events reveals patterns. When you notice that every combine you've owned fails around 3,000 separator hours regardless of maintenance, you know to plan replacement or rebuilding at 2,700 hours.
Coordinating maintenance across shared equipment pools
Larger operations share equipment across multiple fields and crops, which complicates maintenance planning. The combine harvesting wheat in July needs different preparation than when it switches to corn in September. The tractor pulling tillage equipment in fall has different service needs than when running the planter in spring.
Build maintenance coordination into your equipment assignment systems. When planning field sequences, factor in maintenance windows between different operations. Don't schedule the same tractor for 14 straight days of tillage—build in service gaps every 60-80 hours for inspections and preventive maintenance.
For shared equipment, assign primary and backup operators who coordinate on maintenance observations. The primary operator manages scheduled maintenance, but both track warning signs and unusual behavior. This redundancy catches issues that a single operator might normalize over time.
Create transition checklists when equipment switches between operations. Here's what those transitions typically cover:
-
Wheat to corn harvest — change concave settings, inspect rotor bars, adjust cleaning shoe
-
Tillage to planting — hydraulic pressure adjustment, hitch inspection, drawbar reconfiguration
-
Spraying to fertilizing — complete system flush, nozzle change, pump inspection
These transition points become natural maintenance windows. The two days switching a combine from wheat to corn setup provides time for bearing replacement and drive inspection without disrupting harvest flow.
Some farms try to maximize equipment utilization by running machines continuously across operations. This seems efficient but creates serious failure risk. Building roughly 20% maintenance time into equipment scheduling might reduce theoretical capacity, but it prevents the 30-40% capacity loss that comes from unexpected breakdowns during critical operations.
Integrating maintenance into broader operational planning
Maintenance can't exist in isolation from other farm operations. It connects to labor scheduling, parts procurement, cash flow management, and harvest logistics planning.
Your maintenance schedule drives labor requirements. Major winter rebuilds might need additional mechanics. Pre-season preparation often requires all-hands involvement. Plan these labor needs alongside planting and harvest crew requirements, not as an afterthought.
Parts procurement timing affects cash flow too. Ordering $30,000 in combine parts in August impacts operating capital during harvest. Some farms spread purchases across the year to manage cash flow, others concentrate purchases in high-revenue periods. Either approach works, but it needs to be planned.
Connecting maintenance planning to operational software systems helps a lot as scale increases. When AI-powered platforms track equipment hours and field conditions, they can automatically flag when machines approach service intervals adjusted for actual operating conditions. Instead of manually checking hour meters and trying to remember soil conditions from three weeks ago, the system surfaces that the combine will need bearing service in approximately 47 separator hours based on current operating patterns.
This kind of integration becomes more important as operations grow. A 2,000-acre farm can manage maintenance with spreadsheets and memory. At 8,000 acres with twelve major pieces of equipment, you need systematic governance. Operational software that consolidates equipment tracking, maintenance scheduling, and parts inventory prevents the coordination failures that cause unnecessary downtime.
The most successful maintenance programs treat equipment lifecycle management as a core operational function, not a support activity. They allocate real resources, assign clear responsibility, and measure performance through uptime metrics and downtime costs. When maintenance gets embedded in operational planning rather than bolted on as an afterthought, critical failures during peak windows drop significantly.
Moving from reactive repairs to predictive governance
Shifting from fixing broken equipment to preventing failures requires changing how your entire operation thinks about maintenance. It's not enough to create schedules and track hours—you need governance systems that make maintenance planning automatic and inevitable.
Start with an honest look at your current state. How many breakdowns did you have during critical windows last year? What did they actually cost in downtime and yield impact? How much could you have saved through better prediction and parts stocking? These numbers build the case for investing in proper lifecycle governance.
Focus initial efforts on your most critical equipment during your most important operational windows. Better to have solid governance on combines during harvest than mediocre coverage across all equipment year-round. Getting it right on critical equipment builds momentum for expanding the program.
Perfect prediction isn't the goal—profitable operation is. You won't prevent every breakdown. But reducing critical window failures by 60-70% while optimizing parts inventory and maintenance timing delivers real returns. A farm that drops from eight harvest breakdowns to three while trimming parts inventory by 30% has fundamentally improved its operational economics.
The farms that hold up long-term don't just maintain equipment—they govern entire lifecycle systems that balance reliability, cost, and operational impact. They know when components will fail, what those failures actually cost, and how to prevent the ones that matter most. That kind of systematic approach to lifecycle governance, especially when supported by operational software that tracks patterns and predicts failures, turns maintenance from a cost center into something closer to a competitive advantage.
Your farm machinery lifecycle maintenance playbook isn't about following manufacturer schedules or copying what the neighbor does. It's about building governance systems that understand your specific equipment, your operational windows, and your economic reality. When you align maintenance with actual degradation patterns and true downtime costs, equipment stops breaking when you need it most.
Ready to revolutionize your farm management?
Join 500+ farms using Feldsly to boost yields, reduce waste, and streamline daily farm workflows.