



Most farms rank their haulers on one number: rate per loaded mile, or rate per ton. That works fine until the third week of harvest when your cheapest carrier suddenly can't get you trucks, grain is sitting in wet piles, and the guy who charged 8% more is the only one answering the phone at 5 a.m.
Price is the easiest thing to measure and the least useful thing to optimize during your tightest windows. A carrier who's cheap in April and unreachable in October isn't cheap — they're expensive in a way that never shows up on the invoice.
This is about building a local carrier scorecard farm operations can actually use — one that weights punctuality, seasonal capacity flexibility, communication quality, and how a carrier behaves when something goes wrong, not just what they quote. I'll give you sample weightings, a scoring template, and a refresh cadence tied to your season instead of the calendar.
Why price-only carrier ranking quietly costs you the most during peak weeks
During the slow season, every carrier looks roughly the same. They show up, they haul, rates are within a few percent of each other. So the spreadsheet ranks them by price and the lowest number wins the standing relationship.
Then peak hits. Everyone in a 60-mile radius needs trucks in the same two-week stretch. The carriers you built loyalty with — by always chasing the lowest quote — have no reason to prioritize you. They're routing their limited trucks to the farms that pay reliably, communicate clearly, and don't nickel-and-dime them on detention. You optimized for the wrong thing all year, and the bill comes due exactly when you can least afford it.
A grain operation moving 40,000–50,000 bushels a day at peak doesn't lose money slowly when trucks don't show. It loses money in chunks: combines idle waiting for hoppers to clear, grain held on-farm past its quality window, spot-market carriers hired at panic rates running 25–40% over your contracted number.
Carrier failure clusters. It doesn't happen randomly across the year — it happens when demand spikes and your options shrink. A scorecard that ignores that pattern keeps recommending the wrong partners.
What actually predicts a carrier holding up when it counts
Before the weightings, it's worth being clear on what you're actually scoring. Five things, and they're not equally important.
Take control of your farm’s productivity.
Feldsly helps you plan, track, and optimize every farming operation with precision.
- Centralized crop scheduling
- Resource & labor management
- Real-time weather alerts
No credit card required
Price / rate competitiveness. Still matters. Just not first. You want to know if a carrier is reasonable, not whether they're the absolute cheapest.
Punctuality. On-time arrival against the scheduled window, plus turnaround consistency. A carrier who's on time in June but chronically 3 hours late in October is telling you something about where their capacity limits are.
Seasonal capacity flexibility. This is the one most farms don't track. Can this carrier surge? If you normally need 4 trucks and suddenly need 9 for a weather-forced compressed harvest, do they scale or do they cap out? A carrier with steady mid-tier capacity that flexes beats a bigger carrier who's already fully committed during your peak.
Communication quality. How fast do they respond when a load changes? Do they call you proactively when a truck breaks down, or do you find out when it doesn't show? Silence during a problem is worse than the problem itself.
Penalty and problem handling. What happens when they miss? Do they eat a reasonable share of the re-book cost, offer a make-good, or argue every detention charge? This is behavior under stress, and it's the single best predictor of how a carrier treats you next harvest.
The mistake most farms make is treating these as a simple average. They're not. A carrier can be a 9 on price and a 2 on capacity flex, and that 2 should tank them for peak-window purposes even if the average looks fine.
Sample weightings that actually reflect risk
Weightings should shift by season, and I'll get to that. But here's a solid starting point built for a crop farm where the highest-stakes hauling happens in a compressed harvest window.
| Criterion | Off-season weight | Peak-season weight | Why the shift |
|---|---|---|---|
| Price / rate | 35% | 15% | Rate matters most when you have time to shop |
| Punctuality | 20% | 30% | A late truck at peak stalls the whole line |
| Seasonal capacity flexibility | 15% | 30% | Surge ability is worthless off-season, critical at peak |
| Communication quality | 15% | 15% | Consistently important year-round |
| Penalty / problem handling | 15% | 10% | Matters most when problems happen — but informed by how they handled peak |
The logic: off-season, you're building a baseline and price gets to lead. As you approach your critical window, the weightings rotate toward the traits that keep grain moving. A carrier who scored well off-season on price alone will drop in the peak ranking if their capacity flex and punctuality are weak — which is exactly what you want the scorecard to surface.
Score each criterion 1–10, multiply by the weight, sum for a weighted total out of 10. Simple enough to keep in a spreadsheet, structured enough that it stops rewarding the wrong things.
Scoring the fuzzy stuff without kidding yourself
Price and punctuality are easy to score because they're numbers. Communication and penalty handling are where farms either skip the scoring or make it meaningless with vibe-based ratings. Here's how to make them real.
For punctuality, don't score memory — score records. Log scheduled window vs. actual arrival for every load. On-time = within your agreed window (say, 30 minutes). Punctuality score = share of on-time loads, converted to a 1–10 scale. A carrier hitting 92% on-time is a 9; one hitting 70% is a 5. No debate.
For communication quality, score two concrete things:
-
Average response time to a schedule change or question (measured from your actual messages, not gut feel)
-
Proactive notification rate
how often did they tell you about a problem before it hit you, versus you finding out when the truck didn't show?
A carrier who calls when a truck breaks down and offers a backup gets an 8–9. One you had to chase every time is a 3–4.
For penalty / problem handling, keep a short log of every miss and what happened next. Did they re-book at no premium? Eat detention? Offer a make-good load? Argue everything? Three or four incidents across a season tells you almost everything about who to lean on next year.
Worth noting: the act of logging is half the value. Once you're recording arrival times and problem responses per load, the scores almost write themselves, and you stop arguing with yourself about which carrier "felt" reliable.
A workflow for keeping the scorecard alive
A scorecard built once and never updated is just a snapshot that goes stale by the following season. The workflow that keeps it useful:
-
Log per-load data as it happens. Scheduled vs. actual arrival, any communication events, any problems and the resolution. This is a 30-second entry per load, not a project.
-
Roll up scores monthly during active hauling, quarterly otherwise. Convert your logs into the 1–10 scores per criterion.
-
Apply season-appropriate weightings. Off-season weights most of the year, then rotate to peak weights about 6–8 weeks before your critical window.
-
Rank and act. Use the peak ranking to lock commitments early with your top resilience-weighted carriers — before everyone else in the county is calling them.
-
Refresh after every peak. The most important update happens right after harvest, while the memory of who showed up and who ghosted is still fresh.
That last step is where the whole thing earns its keep. How your carriers behaved during the tightest two weeks of the year is the single best input you'll get, and it evaporates from memory within a month if you don't capture it immediately.
Farms already running structured supplier evaluation for inputs will recognize the logic — it's the same discipline applied to transport instead of fertilizer and seed. If you've built out supplier scorecards on the procurement side, the approach in the seasonal input procurement playbook translates almost directly to carriers, just with capacity flex and punctuality replacing lead-time and fill-rate as the headline metrics.
Here's a simple visual of that workflow.
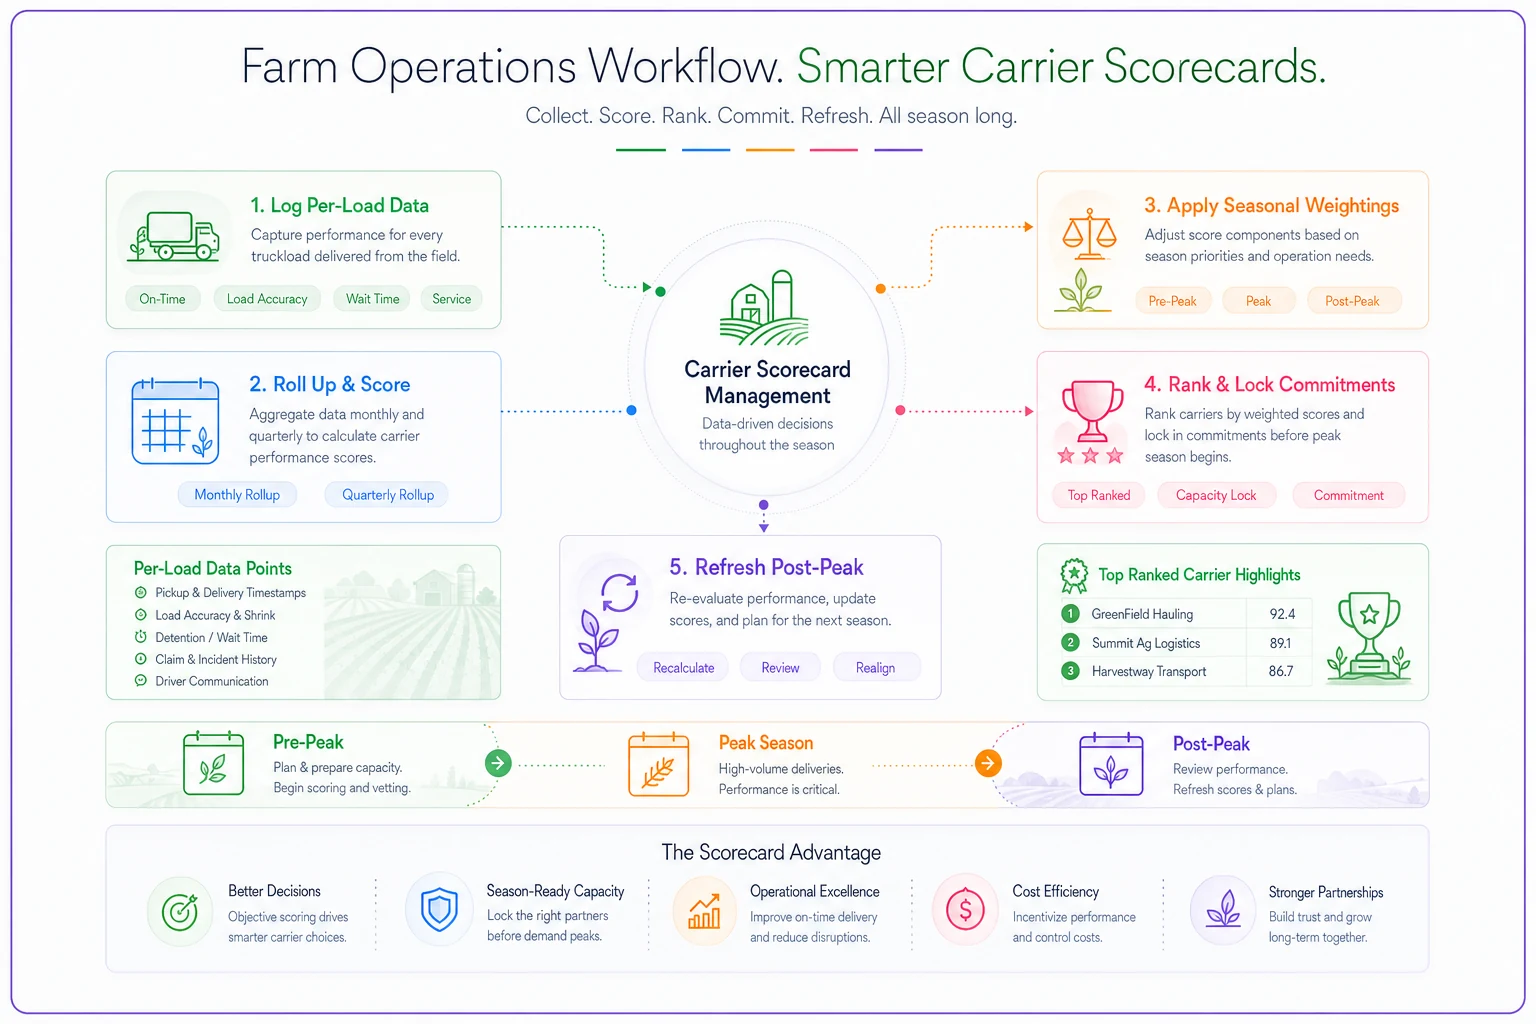
Keep it simple and visible to the team.
Seasonal refresh cadence: tie it to your calendar, not the calendar
Generic advice says "review quarterly." For a farm, quarterly reviews miss the point because your risk isn't spread evenly across quarters. Refresh cadence should map to your operational calendar:
-
6–8 weeks pre-peak Switch to peak weightings, rank carriers, and lock capacity commitments with your top-ranked partners.
-
Weekly during active peak hauling Quick check on punctuality and problem logs. If a carrier is sliding, you want to know in week one of harvest, not week three.
-
Immediately post-peak The big refresh. Update every score while the season is fresh. Flag any carrier who failed the capacity-flex test.
-
Once mid-off-season Bring in any new carriers, re-baseline on price, prune anyone who's consistently near the bottom.
The pattern most farms fall into is reviewing carriers when they're already unhappy — which means the review is reactive and running on emotion rather than season data. A cadence tied to your peak forces the review to happen while it's actually useful.
A real scenario
A mid-size corn and soybean operation, roughly 3,800 acres, ran three regular carriers plus whoever they could grab on the spot market at harvest. They ranked purely on rate. Their cheapest carrier won most of the standing work.
Two harvests in a row, that carrier capped out during the compressed window and left them scrambling for spot trucks at rates 30%+ over contract. The manager estimated the two-season cost of panic-rate hauling plus combine idle time somewhere in the $18k–$24k range — none of which showed up as a "carrier problem" on any report, because on paper their main carrier was the cheapest.
They built a weighted scorecard, logged arrival times and problem responses for one full season, and applied peak weightings before the next harvest. The scorecard surfaced something they'd half-known: their second-most-expensive carrier scored highest on capacity flex and communication and was the one who'd quietly bailed them out both prior years. They shifted the standing peak commitment to that carrier and locked it 7 weeks early.
The following harvest they still hit weather-forced surges, but spot-market panic hires dropped to almost nothing. Combine idle time from missing trucks was, in the manager's words, "not a thing we talked about this year." The rate per ton on the standing carrier was a bit higher. The total cost of moving the crop was lower.
When this is worth the effort — and when it isn't
When it makes sense: You have a compressed, high-stakes hauling window; you use more than two carriers; and you've been burned at least once by a truck that didn't show. The more your harvest depends on grain moving fast, the more the resilience weighting pays for itself.
When it's overkill: If you run one carrier under a solid long-term contract and they've never failed you, a formal weighted scorecard is more process than you need. Keep a simple problem log and move on.
Who should not bother: Very small operations moving crop with their own trucks and no meaningful reliance on third-party carriers. There's nothing to score.
Where good record-keeping quietly does the heavy lifting
The scorecard is only as good as the data feeding it, and the failure mode is always the same: nobody logs arrival times and problem responses in the moment, so at refresh time it's all reconstructed from memory — which favors whoever complained loudest, not whoever performed best.
Keep per-load timestamps, communication events, and problem resolutions in one shared place to make scoring fast and objective.
Keeping per-load timestamps, communication events, and problem resolutions in one place, updated as loads move rather than reconstructed after the season, is what turns a scorecard from a guessing exercise into an actual decision tool. Whether that's a shared spreadsheet with disciplined entry or an operations platform that logs it alongside your other harvest data matters less than the habit itself.
Carrier reliability is really a subset of the broader risk picture on a farm, and it responds to the same operational thinking. If you're working through how you handle transport shocks, it's worth reading it alongside the wider operational risk-management framework — a carrier who vanishes at peak is functionally the same kind of shock as a contract falling through. Predictable in category, unpredictable in timing, and manageable only if you've prepared before it hits.
The core shift is small but it changes everything downstream: stop asking "who's cheapest?" and start asking "who's still moving my grain in the worst two weeks of the year?" Weight your scorecard for that question, refresh it while the season is fresh, and lock your best carriers before your neighbors realize they need to.
Ready to revolutionize your farm management?
Join 500+ farms using Feldsly to boost yields, reduce waste, and streamline daily farm workflows.